त्वरित लिंक
Silver at $57.44 — Down 53% From January 2026 ATH as Fed Tightening Risk Crushes Leveraged Longs
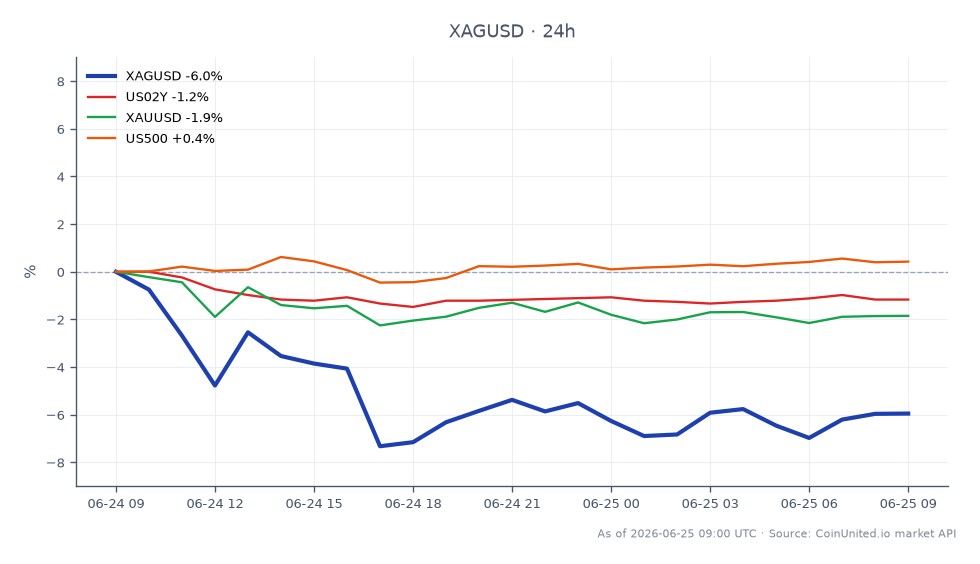
डेटा स्नैपशॉट
मुख्य निष्कर्ष
- •Silver is trading at $57.44, down 53%+ from its January 2026 ATH of ~$121.62/oz — one of the largest precious-metals drawdowns on record.
- •The January 30, 2026 CME margin hike triggered a ~30% single-day crash, demonstrating how leverage amplification can cause catastrophic losses even for well-positioned traders.
- •A 20x long Silver CFD at $60/oz faces full liquidation on a move to ~$57 — well within the current day's trading range, underscoring extreme position-sizing discipline required.
- •CME FedWatch shows zero rate-cut probability in 2026 and a ~35% chance of a hike, keeping real yields elevated and the USD bid — the primary structural headwind for silver and gold.
- •Cross-market: Gold, EUR/USD, and risk assets including Bitcoin all face the same real-yield/USD tightening channel; silver miner equities historically suffer 50-70% drawdowns on this scale of metal-price decline.
Silver has collapsed from its January 2026 all-time high of approximately $121.62/oz to the current spot price of $57.44, a peak-to-trough drawdown exceeding 52%, according to data compiled by Bullion
Event Summary
Silver has collapsed from its January 2026 all-time high of approximately $121.62/oz to the current spot price of $57.44, a peak-to-trough drawdown exceeding 52%, according to data compiled by BullionVault and GoldSilver.com. The initial shock came on January 30, 2026, when CME Group raised margin requirements on silver futures, triggering one of the largest single-day crashes on record — an estimated 30% intraday decline that cascaded into weeks of forced liquidations.
As reported by precious-metals market commentators citing CME FedWatch data, the macro backdrop has remained hostile: zero probability of Fed rate cuts in 2026 and a non-trivial probability of a rate hike by year-end. This Fed macro policy crossroads — higher real yields, a strengthening dollar, and persistent inflation — has systematically compressed the premium that drove silver to blow-off highs.
Leverage Impact Analysis
The January margin-hike event is the textbook case for leverage risk in commodities. A trader holding a 50x long Silver CFD on CoinUnited.io at $100/oz (mid-run level) with $1,000 margin would have controlled $50,000 notional. A 30% single-day drop to $70/oz would have produced a $15,000 loss — wiping the position 15x over, triggering automatic liquidation well before the full move.
At the current price of $57.44 (24h range: $56.35–$57.89), the FOMC inflation policy crossroads remains the key variable. Consider the following live scenarios:
- -20x long at $60/oz (hypothetical re-entry): A move back to $56.35 (today's low) = -6.1% on notional = -122% on margin — full liquidation on a single session's range.
- -10x long at $57.44: A 10% adverse move to ~$51.70 wipes the position. Given that silver has already demonstrated 30% single-session moves, this is well within tail-risk territory.
- -Short-side risk: A short squeeze toward the $65–$70 zone (where multiple prior support levels became resistance) at 20x leverage would cost ~25–43% on notional — 5x to 8.5x the margin posted.
Post-crash, silver almost certainly resides in an elevated volatility regime. Monitor open interest on CoinUnited.io for confirmation of positioning direction before sizing entries. The risk-off inflation capital flight dynamic means that even a modest USD uptick can move silver 3–5% intraday.
Cross-Market Impact
Silver's crash is inseparable from the broader gold vs. US dollar macro regime. Gold dropped more than 20% from its own record before partially recovering, per BullionVault. The DXY (US Dollar Index) strength cited as a primary driver also pressures EUR/USD, where a stronger dollar compresses the pair and tightens financial conditions globally.
Equity cross-effects are meaningful: elevated real yields weigh on rate-sensitive sectors in the S&P 500, particularly tech and utilities. Silver-intensive sectors — solar/PV manufacturers, electronics OEMs — may see input cost relief if lower prices persist, creating a divergent equity trade. Pure-play silver miners face 50–70% drawdowns historically on this scale of metal-price decline. Meanwhile, Bitcoin has shown sensitivity to the same real-yield tightening channel, making the macro read consistent across risk assets. Geopolitical headlines around Iran remain a wildcard — a temporary U.S. pause on strikes previously triggered a sharp metals rebound, per precious-metals daily reports.
Trading Considerations
Key levels to watch on Silver / US Dollar: the $56.35 intraday low is immediate support; a breach opens the $51–$52 volume void from the early-2026 ascent. To the upside, $65–$70 represents a density of prior support-turned-resistance and the zone where multiple short-covering rallies stalled. The gold-silver ratio has widened dramatically; mean-reversion trades in this ratio carry their own leverage risk and warrant conservative sizing.
The Fed policy path — specifically any CME FedWatch shift toward cut probability or geopolitical escalation softening the USD — is the primary catalyst for any durable recovery. Until then, the structural macro inflation risk-off repricing thesis favors range-bound to downward pressure on silver.
Trade Silver / US Dollar on CoinUnited.io
Trade XAGUSD with up to 1000xx leverage → | Create Free Account
अक्सर पूछे जाने वाले प्रश्न
Given silver has demonstrated 30% single-session moves and is in an elevated volatility regime, even 5–10x leverage carries significant liquidation risk on intraday swings — the $56.35–$57.89 daily range alone is enough to liquidate a 20x position opened near session highs.
जारी रखें अन्वेषण
अस्वीकरण: यह संक्षेप केवल शैक्षिक उद्देश्यों के लिए है और यह निवेश सलाह नहीं है।