त्वरित लिंक
Hawkish Fed + Iran Deal: Double Pressure on Gold & Silver — Liquidation Risk for Leveraged Metals Longs
डेटा स्नैपशॉट
मुख्य निष्कर्ष
- •A 50x long silver CFD entered at $65.00 is already showing ~80% margin loss at current $63.94 price — positions above 48x leverage near recent highs face liquidation without additional margin.
- •Gold broke below its 200-day EMA post-FOMC, with bearish EMA crossovers (9/20/50 under 100) signaling a medium-term directional bias lower.
- •The U.S.–Iran 14-point memorandum opens a 60-day Hormuz negotiation window, reducing oil supply shock risk and stripping geopolitical inflation-hedge premium from metals.
- •The gold–silver ratio has risen from ~52.6 to ~62.6 with resistance near 65–67 — a relative-value opportunity for traders comfortable positioning across both metals.
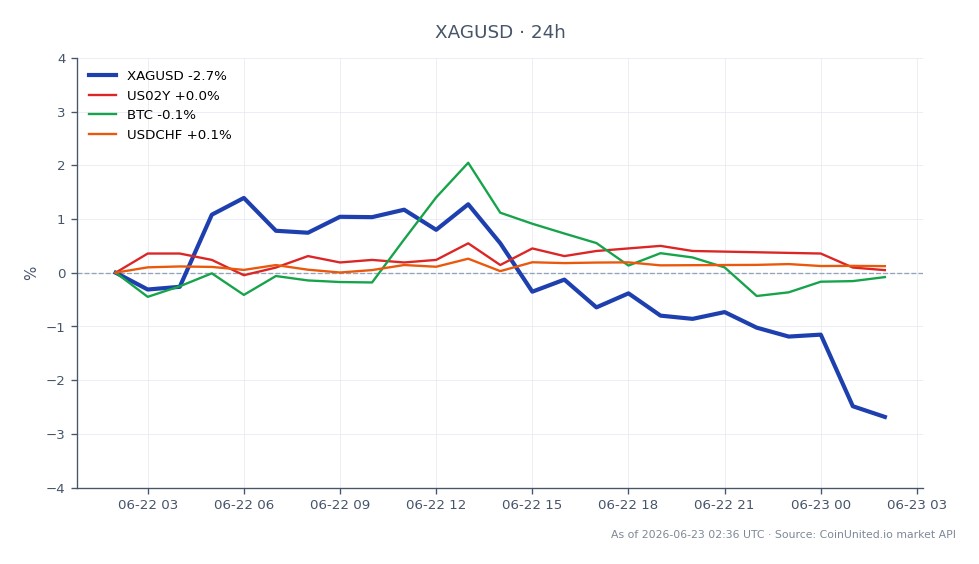
- •Higher U.S. real yields and a stronger DXY create cross-market headwinds for Bitcoin and other speculative assets alongside precious metals.
According to Kitco and corroborated by Investing.com and FXStreet, gold and silver face a dual headwind: a hawkish Federal Reserve tilt and a preliminary U.S.–Iran de-escalation agreement. The Fed hel
Event Summary
According to Kitco and corroborated by Investing.com and FXStreet, gold and silver face a dual headwind: a hawkish Federal Reserve tilt and a preliminary U.S.–Iran de-escalation agreement. The Fed held its policy rate at 3.50%–3.75% but revised inflation forecasts higher, with more officials projecting at least one rate hike in 2026 — scaling back rate-cut expectations and strengthening the U.S. dollar. Simultaneously, a reported 14-point U.S.–Iran memorandum opens a 60-day negotiation window with Iran allowing toll-free Strait of Hormuz passage, targeting full traffic restoration within 30 days. Gold futures broke below their 200-day EMA post-FOMC, while silver currently trades at $63.94 (–1.98%), off its 24-hour high of $65.20.
The convergence of higher real yields and reduced geopolitical risk premium creates a structurally bearish medium-term setup for precious metals, as detailed in our Fed Macro Policy Crossroads theme.
Leverage Impact Analysis
With silver at $63.94 and down 1.98% on the day, leveraged longs are already under stress. Consider a trader holding a 50x long silver CFD entered at $65.00: that position is currently showing a ~1.6% adverse move, which translates to an 80% loss on margin at 50x. A move to the 24-hour low of $63.64 would represent a ~2.1% decline from entry — sufficient to trigger liquidation for positions at 48x leverage or above without added margin buffer.
For gold, the break below the 200-day EMA and bearish crossover of the 9/20/50 EMAs beneath the 100 EMA signals sustained directional pressure. Traders holding leveraged gold CFD longs on CoinUnited.io should note that rallies toward the 200-day EMA now represent technical resistance rather than support — high-leverage entries on bounces face asymmetric risk.
The gold–silver ratio has risen from ~52.6 to ~62.6, with resistance eyed near 65–67. A rising ratio in this environment typically signals gold outperforming silver on the downside, or silver lagging on any recovery. Relative-value traders may consider positioning around this ratio using CoinUnited's up to 2000x leverage on both silver/USD and gold/USD CFDs.
Cross-Market Impact
The Fed & ECB Policy Divergence Repricing dynamic strengthens the U.S. dollar index (DXY), which maintains inverse pressure on gold and silver per the gold–USD inverse relationship. USD/JPY sees upward pressure from higher U.S. rate expectations, while safe-haven flows into CHF are partially unwound as Iran tensions ease.
The Iran De-escalation Energy Trade Pivot clears Hormuz passage, suppressing Brent and WTI tail-risk premia. Lower oil shock risk is disinflationary at the margin — reducing the urgency of gold as an inflation hedge and pressuring inflation breakevens. Bitcoin faces a parallel headwind: the hawkish Fed raises discount rates on speculative assets, while reduced geopolitical tail risk removes some safe-haven demand. Energy-importing equities (airlines, industrials) stand to benefit from the lower oil risk environment.
Trading Considerations
Key levels for silver: resistance at the 24-hour high of $65.20 and the prior support zone; immediate support at $63.64 (24-hour low) with further downside contingent on USD strength and yield trajectory. Watch incoming U.S. CPI/PCE prints and labor data as the primary quantitative catalysts that could either reinforce or challenge the Fed's hawkish stance. Progress or disruptions within the 60-day Iran negotiation window remain the key geopolitical trigger — any breakdown would rapidly reverse the inflation-hedge discount currently priced into metals. Monitor the gold–silver ratio at the 65–67 resistance band for relative-value signals.
Trade Silver / US Dollar on CoinUnited.io
Trade XAGUSD with up to 1000xx leverage → | Create Free Account
अक्सर पूछे जाने वाले प्रश्न
A 50x long position has a liquidation threshold roughly 2% below entry (depending on margin requirements); from $63.94, a move toward ~$62.66 or below would typically trigger forced liquidation — the 24h low of $63.64 is already dangerously close for high-leverage entries near $65.
जारी रखें अन्वेषण
अस्वीकरण: यह संक्षेप केवल शैक्षिक उद्देश्यों के लिए है और यह निवेश सलाह नहीं है।