त्वरित लिंक
Gold Holds Bearish Bias at $4,207 After Hawkish Fed Dot Plot — Data Flow Now Drives the Next Move
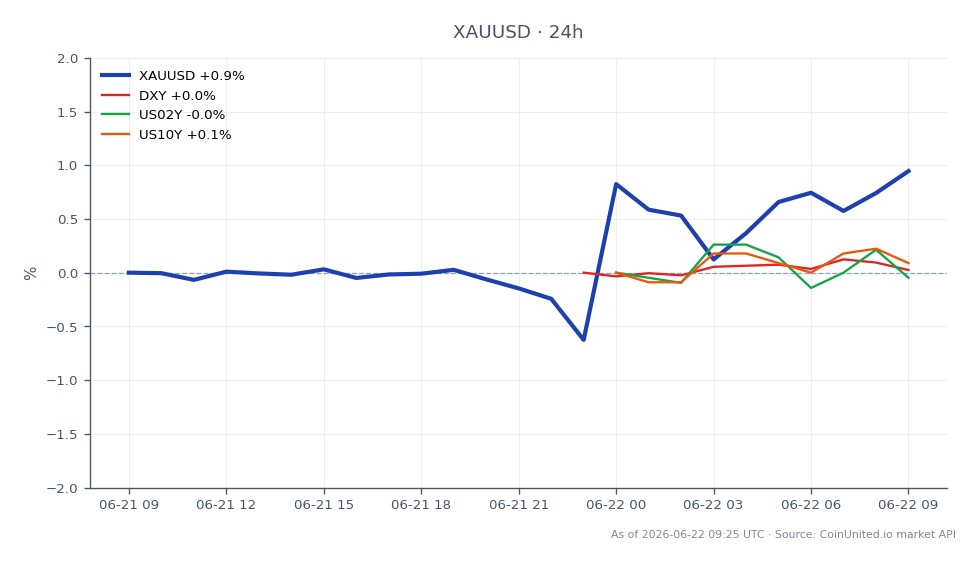
डेटा स्नैपशॉट
मुख्य निष्कर्ष
- •Gold is at $4,206.65, structurally bearish below $4,360 resistance after the Fed's hawkish dot plot repriced year-end tightening from 18 bps to 37 bps.
- •Leverage risk is asymmetric: a 50x long Gold CFD entered at $4,260 is already ~62% into its margin drawdown at current prices — position sizing is critical.
- •The $4,000 level is the primary downside magnet; a break there opens $3,885–$3,920 as the next support cluster.
- •Cross-market: a firmer USD and elevated real yields compound gold's headwind; silver, platinum, and risk assets (BTC, S&P 500) face sympathetic pressure.
- •The bearish bias is entirely data-dependent — PCE, GDP, and jobless claims can rapidly unwind the hawkish repricing if they disappoint.
According to reporting from Kitco and FX Street, gold has entered a sustained bearish phase following the Federal Reserve's hawkish dot plot, which signaled a potential rate hike this year. As reporte
Event Summary
According to reporting from Kitco and FX Street, gold has entered a sustained bearish phase following the Federal Reserve's hawkish dot plot, which signaled a potential rate hike this year. As reported by InvestingLive, the repricing was significant: traders moved from pricing roughly 18 basis points of tightening to 37 basis points by year-end, with approximately a 30% probability of a July hike and 65% for September. Gold failed to hold above $4,360 and sold off toward the $4,240–$4,260 zone. At the time of writing, XAU/USD sits at $4,206.65, with a 24-hour range of $4,136.48–$4,221.09.
The core transmission mechanism, as covered in our FOMC Inflation Policy Crossroads analysis, is rising real yields increasing the opportunity cost of holding non-yielding bullion. With the Fed Macro Policy Crossroads now firmly data-dependent, the next directional leg hinges on incoming PCE, GDP, PMI, and jobless claims prints.
Leverage Impact Analysis
With gold at $4,206.65, the distance to the cited $4,000 downside magnet represents a ~4.9% drawdown — a move that can wipe out leveraged longs rapidly.
Worked example — long position under pressure: A trader opening a 50x long Gold CFD at $4,260 (near the post-Fed stabilization level) now sits approximately $53 offside at $4,206.65. That 1.24% adverse move equates to a 62% drawdown on margin at 50x. At 100x leverage, the same move is effectively margin-terminal without a stop.
Liquidation zone to watch: Short-term resistance at $4,360 means any recovery attempt faces a ~3.6% upside buffer. However, a break below current support toward $4,000 — a move of ~4.9% — would liquidate 20x+ long positions entered anywhere above $4,400 without adequate stops.
Short-side consideration: Bears targeting $4,000 from current levels carry a defined 4.9% reward but face a violent squeeze risk if data softens. Position sizing discipline is critical in a data-dependent environment where a single PCE miss could trigger a rapid 2–3% reversal.
Check live funding rates on CoinUnited.io before sizing — persistent bearish positioning may be reflected in negative funding (longs paying shorts), which erodes carry on short-term holds.
Cross-Market Impact
The hawkish Fed repricing ripples well beyond gold. The U.S. Dollar Currency Index typically strengthens when rate expectations rise, compounding gold's headwind through the gold-dollar inverse relationship. EUR/USD faces downward pressure from widening rate differentials, while the 2-year Treasury yield — the most Fed-sensitive tenor — should remain elevated, reinforcing the real yield squeeze on bullion.
For Bitcoin and the broader S&P 500, tighter-for-longer policy is a headwind to risk assets, particularly duration-sensitive tech. Silver and platinum face sympathy selling through precious metals sentiment, though silver's industrial demand component provides partial insulation. Gold miners (not directly tradeable on CoinUnited) face a double compression: lower bullion prices plus higher discount rates.
Trading Considerations
Key structure: $4,360 is the level gold must reclaim to invalidate the bearish bias; $4,000 and then $3,885–$3,920 are the downside targets cited across multiple sources. Current price at $4,206.65 sits in the middle of this range — a technically neutral zone that offers poor risk/reward for directional conviction without data confirmation.
The catalyst calendar is the priority: PCE, GDP, PMI, and jobless claims releases will either validate the Fed's hawkish stance or trigger a repricing unwind. Traders should monitor 10-year Treasury yields in real-time as the most direct proxy for gold's fair value pressure.
Trade Gold / US Dollar on CoinUnited.io
Trade XAUUSD with up to 2000xx leverage → | Create Free Account
अक्सर पूछे जाने वाले प्रश्न
At 50x leverage, a 2% adverse move from entry wipes out the entire margin — gold's current range of $4,136–$4,221 already represents an intraday swing of ~2%. Traders should size positions so that a move to $4,000 (4.9% below current price) does not exceed predefined maximum loss.
जारी रखें अन्वेषण
अस्वीकरण: यह संक्षेप केवल शैक्षिक उद्देश्यों के लिए है और यह निवेश सलाह नहीं है।