Quick Links
Qualcomm Beats Q4 Forecasts but Light Profit Guidance Sends Shares Lower — QCOM Leverage Scenarios & Semi Sector Read-Through

Data Snapshot
Key Takeaways
- •Qualcomm's Q4 adjusted EPS of ~$2.17 beat the ~$2.16 consensus, but Q1 EPS guidance midpoint of $2.25 fell short of the $2.26–$2.32 range — a profitability miss, not a revenue miss.
- •Leveraged long QCOM CFD traders face acute whipsaw risk: a 50x position opened at $172.18 is fully liquidated on a 2% adverse move, and the after-hours drop hit that threshold.
- •The intraday recovery to +4.69% from post-earnings lows suggests the market sees the guidance miss as cyclical (memory, smartphones) rather than structural — but confirmation is needed.
- •Cross-market read-through is selective: memory producers may benefit from tight supply pricing power, while smartphone OEMs and mobile-chip peers face incremental demand headwinds.
- •Year-over-year EPS declined from $3.00 to ~$2.17, signaling ongoing earnings deterioration that could keep institutional sellers active on rallies toward resistance at $172.55.
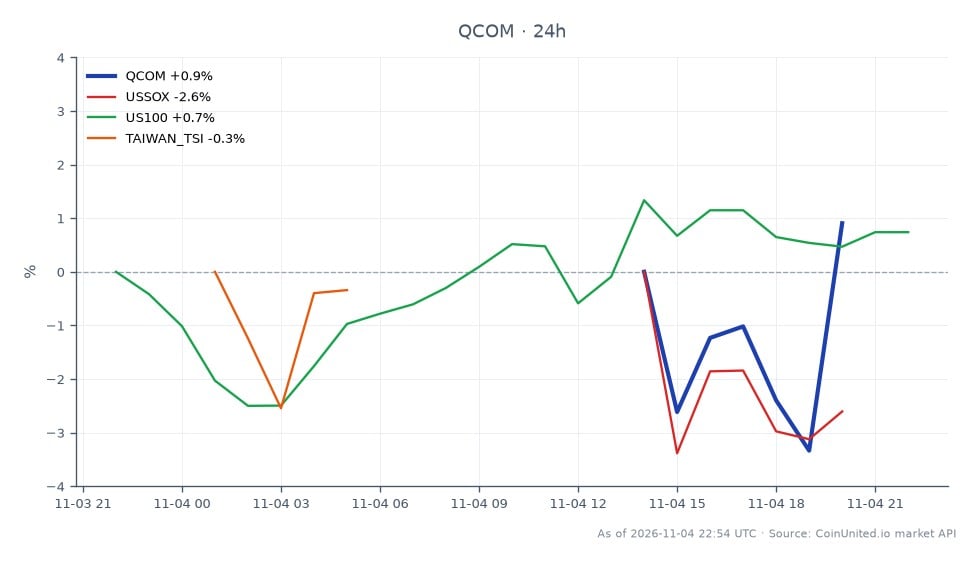
As reported by CNBC and Yahoo Finance, Qualcomm Incorporated posted fiscal Q4 adjusted EPS of approximately $2.17, narrowly beating the ~$2.16 consensus, while revenue came in between $10.32B and $10.
Event Summary
As reported by CNBC and Yahoo Finance, Qualcomm Incorporated posted fiscal Q4 adjusted EPS of approximately $2.17, narrowly beating the ~$2.16 consensus, while revenue came in between $10.32B and $10.44B versus ~$10.12B expected. Despite the beat, Qualcomm shares fell roughly 2% in extended trading as investors focused on forward guidance.
For fiscal Q1, Qualcomm guided adjusted EPS of $2.15–$2.35 (midpoint $2.25), falling short of consensus estimates in the $2.26–$2.32 range. Revenue guidance of $10.4B–$11.2B (midpoint $10.8B) was broadly in line, indicating the disappointment is a margin and profitability story, not a demand collapse. Coverage cited memory shortages, weaker smartphone demand, and higher-than-expected capex as key headwinds. Year-over-year, Q4 adjusted EPS of $2.17 compares unfavorably to the prior year's $3.00, underscoring ongoing earnings deterioration.
Leverage Impact Analysis
With QCOM currently trading at $172.18 (24h range: $162.76–$172.55), the after-hours ~2% drop implies a move toward ~$168.70. For leveraged CFD traders, this is a high-stakes setup:
- -50x long QCOM CFD opened at $172.18: A 2% adverse move to ~$168.74 represents a ~100% loss of margin on a 50x position — full liquidation territory. Traders must size accordingly.
- -20x long at $172.18: A 2% drawdown to ~$168.74 consumes ~40% of margin, leaving limited buffer if the sell-off deepens on guidance repricing.
- -Short scenario: A 20x short entered at $172.18 targeting the guidance miss would have captured ~40% return on a 2% move; however, today's +4.69% intraday recovery to $172.18 would have liquidated short positions opened near the post-earnings low of $162.76.
The mixed signal — a beat on results, miss on profit guidance — creates whipsaw risk. The Q3 earnings miss mega-cap repricing pattern suggests initial sell-offs on guidance cuts can be followed by mean-reversion rallies as the market digests whether the miss is structural or cyclical. Monitor funding rates and open interest on QCOM perpetual-equivalent CFDs for squeeze confirmation signals.
Cross-Market Impact
Qualcomm's margin pressure from memory shortages and smartphone softness creates a targeted but meaningful read-through across semis and adjacent markets:
- -PHLX Semiconductor Index (SOX): Modest negative bias. QCOM's handset-driven earnings deterioration weighs on mobile-exposed names like Analog Devices and Broadcom, though the revenue guidance resilience limits broader sector damage.
- -NASDAQ 100: Limited direct drag — QCOM is not a top-5 constituent by weight, but sentiment-linked selling in semis can pressure the index.
- -Taiwan TAIEX: Watch for read-through to TSMC and Mediatek on smartphone demand signals and memory supply constraints.
- -Memory producers: Tight memory supply supports pricing power for DRAM/NAND suppliers even as it squeezes Qualcomm's margins — a divergent trade opportunity.
- -Smartphone OEMs: Qualcomm's handset commentary reinforces caution on the near-term consumer electronics cycle.
- -AI semiconductor capex: Qualcomm's higher capex signal and automotive chip diversification remain a secondary narrative; the sell-off may create entry points for traders focused on QCOM's longer-term AI edge compute exposure.
Trading Considerations
Key levels to watch: immediate support at the 24h low of $162.76 (the after-hours reaction floor), with resistance at $172.55 (24h high). The stock has recovered +4.69% intraday from post-earnings lows, suggesting the initial guidance-miss sell-off found buyers. The core risk is whether Q1 margin compression — driven by memory costs and smartphone mix — deepens as the quarter progresses.
Watch for analyst estimate revisions and any management commentary on handset inventory normalization. The semiconductor supply chain geopolitics angle remains a secondary risk factor, particularly if memory shortages are partly supply-chain driven rather than purely cyclical.
Trade Qualcomm Incorporated on CoinUnited.io
Trade QCOM with up to 800x leverage → | Create Free Account
_Availability and maximum leverage depend on product, jurisdiction and account eligibility. Leverage amplifies losses and positions can be liquidated._
Frequently Asked Questions
With a 24h range of $162.76–$172.55 (a ~5.9% swing), positions above 17x leverage risk full margin wipeout within a single session's move. Sizing to no more than 10x–15x keeps a 5% adverse move from exceeding 75% margin loss.
Continue Exploring
Disclaimer: This brief is for educational purposes only and is not investment advice.
">%0D%0A <path d="m65.883 9.018.032 5.181h-1.223c-.773-3.733-2.671-5.73-5.797-5.73-4.441 0-6.5 4.442-6.5 9.913 0 5.985 2.38 10.588 6.79 10.588 3.024 0 5.084-1.898 6.211-6.597h1.287l-.482 6.05a13.606 13.606 0 0 1-7.434 1.93c-7.016 0-11.36-4.409-11.36-11.071 0-7.467 4.989-12.166 11.36-12.166a12.961 12.961 0 0 1 7.112 1.899M68.714 21.89c0-5.47 3.572-9.236 8.367-9.236a7.95 7.95 0 0 1 8.271 8.496c0 5.471-3.573 9.205-8.367 9.205a7.908 7.908 0 0 1-8.271-8.464zm11.876.354c0-4.762-1.095-8.406-3.669-8.406-2.38 0-3.478 2.703-3.478 6.92 0 4.762 1.126 8.431 3.701 8.431 2.382 0 3.444-2.735 3.444-6.956M93.236 27.555c0 1.126.515 1.318 2.03 1.416v1.062h-8.497V28.97c1.514-.097 2.03-.29 2.03-1.415V16.16l-1.93-1.126v-.611l5.663-1.77h.709l-.005 14.9zM88.345 8.18a2.625 2.625 0 0 1 5.246 0 2.625 2.625 0 0 1-5.246 0zM109.007 18.157c0-1.867-.709-2.8-2.479-2.8a6.474 6.474 0 0 0-3.604 1.319v10.877c0 1.126.482 1.319 1.962 1.416v1.062h-8.432V28.97c1.513-.097 2.029-.29 2.029-1.416V16.16l-1.93-1.126v-.612l5.76-1.77h.741l-.129 3.154a7.735 7.735 0 0 1 5.954-3.153c3.025 0 4.602 1.739 4.602 5.245v9.655c0 1.126.514 1.319 1.995 1.416v1.062h-8.432V28.97c1.48-.097 1.963-.29 1.963-1.416v-9.396zM123.52 21.851c0 3.927 1.706 6.308 5.247 6.308 3.54 0 5.985-1.867 5.985-6.5V10.82c0-1.74-.419-2.03-3.058-2.253V7.442h7.37v1.126c-2.252.258-2.574.515-2.574 2.253v11.425c0 5.535-3.797 8.116-8.561 8.116-5.697 0-9.108-2.64-9.108-8.174v-11.4c0-1.77-.321-1.965-2.574-2.221V7.44h9.849v1.126c-2.253.258-2.574.45-2.574 2.22l-.002 11.064zM152.26 18.157c0-1.867-.707-2.8-2.478-2.8a6.484 6.484 0 0 0-3.605 1.319v10.877c0 1.126.483 1.319 1.964 1.416v1.062h-8.432V28.97c1.513-.097 2.029-.29 2.029-1.416V16.16l-1.931-1.126v-.612l5.761-1.77h.74l-.129 3.154a7.731 7.731 0 0 1 5.953-3.153c3.025 0 4.602 1.739 4.602 5.245v9.655c0 1.126.514 1.319 1.996 1.416v1.062h-8.432V28.97c1.479-.097 1.962-.29 1.962-1.416v-9.396zM166.259 27.555c0 1.126.515 1.318 2.029 1.416v1.062h-8.496V28.97c1.512-.097 2.029-.29 2.029-1.415V16.16l-1.932-1.126v-.611l5.664-1.77h.709l-.003 14.9zM161.368 8.18a2.62 2.62 0 0 1 2.622-2.518 2.625 2.625 0 0 1 2.623 2.518 2.626 2.626 0 0 1-4.441 1.786 2.62 2.62 0 0 1-.804-1.786zM175.33 12.976h4.183v1.48h-4.183v10.652c0 1.964.741 2.8 2.253 2.8a3.755 3.755 0 0 0 2.414-.901l.387.58a5.65 5.65 0 0 1-4.956 2.768c-2.64 0-4.57-1.384-4.57-4.989v-10.91h-1.996v-.741a13.265 13.265 0 0 0 5.508-4.928h.965l-.005 4.189zM195.514 19.38v.741h-10.492c-.129 4.506 2.189 7.177 5.342 7.177a5.427 5.427 0 0 0 4.796-2.609l.515.29a6.75 6.75 0 0 1-6.888 5.374c-4.665 0-7.787-3.443-7.787-8.406 0-5.507 3.539-9.3 7.948-9.3 4.313 0 6.566 2.864 6.566 6.726m-10.427-.45h6.437c0-3.025-.805-5.085-2.899-5.085-2.125 0-3.283 2.125-3.541 5.084M207.001 7.054v-.676l5.696-1.545h.707v21.788c0 1.094.064 1.45 1.287 1.545l.805.064v.965l-5.857 1.16h-.838l.129-2.993a6.145 6.145 0 0 1-5.181 2.993c-3.895 0-6.5-3.154-6.5-8.046 0-6.087 3.604-9.59 8.206-9.59a5.117 5.117 0 0 1 3.478 1.126V8.048l-1.932-.994zm-5.342 13.709c0 3.926 1.609 6.855 4.538 6.855a3.901 3.901 0 0 0 2.736-1.03v-8.496c0-2.51-1.062-3.99-2.993-3.99-2.703 0-4.28 2.64-4.28 6.667M219.683 24.754a2.796 2.796 0 0 1 2.587 1.729 2.8 2.8 0 1 1-5.387 1.072 2.75 2.75 0 0 1 1.721-2.6 2.753 2.753 0 0 1 1.079-.2zM230.592 27.555c0 1.126.516 1.318 2.029 1.416v1.062h-8.501V28.97c1.512-.097 2.03-.29 2.03-1.415V16.16l-1.932-1.126v-.611l5.664-1.77h.708l.002 14.9zM225.7 8.18a2.626 2.626 0 0 1 4.441-1.787c.488.47.777 1.11.804 1.787a2.625 2.625 0 0 1-5.245 0zM233.842 21.89c0-5.47 3.573-9.236 8.367-9.236a7.95 7.95 0 0 1 8.271 8.496c0 5.471-3.572 9.205-8.366 9.205a7.904 7.904 0 0 1-7.809-5.179 7.904 7.904 0 0 1-.463-3.285zm11.876.354c0-4.762-1.094-8.406-3.669-8.406-2.382 0-3.479 2.703-3.479 6.92 0 4.762 1.126 8.431 3.7 8.431 2.382 0 3.444-2.735 3.444-6.956M18.386.684a17.469 17.469 0 1 0 0 34.937 17.469 17.469 0 0 0 0-34.937zm0 31.74a14.277 14.277 0 1 1 0-28.554 14.277 14.277 0 0 1 0 28.554z" fill="%23fff"/>%0D%0A <path d="M18.393 36.019a17.868 17.868 0 1 1 17.86-17.868 17.887 17.887 0 0 1-17.86 17.868zm0-34.938a17.07 17.07 0 1 0 17.063 17.07 17.089 17.089 0 0 0-17.063-17.07zm0 31.74a14.675 14.675 0 1 1 10.366-4.297 14.691 14.691 0 0 1-10.373 4.303m0-28.552a13.877 13.877 0 1 0 13.879 13.878A13.893 13.893 0 0 0 18.386 4.275z" fill="%23fff"/>%0D%0A <path d="M17.42 8.46a8.46 8.46 0 1 1-16.923 0 8.46 8.46 0 0 1 16.924 0" fill="%23E48A22"/>%0D%0A </g>%0D%0A <defs>%0D%0A <clipPath id="sy6kzo59ya">%0D%0A <path fill="%23fff" transform="translate(.5)" d="M0 0h250v36.019H0z"/>%0D%0A </clipPath>%0D%0A </defs>%0D%0A</svg>%0D%0A)

">%0D%0A<path d="M150.992 39.6878C150.992 40.2541 150.881 40.8147 150.664 41.3378C150.447 41.8609 150.128 42.3362 149.728 42.7364C149.327 43.1366 148.851 43.454 148.327 43.6704C147.803 43.8868 147.242 43.998 146.675 43.9976H5.32749C4.18202 43.999 3.0829 43.5457 2.27184 42.7375C1.46077 41.9293 1.00417 40.8323 1.00244 39.6878V5.31723C1.00398 4.17212 1.46033 3.07443 2.27127 2.26526C3.08221 1.45608 4.18142 1.00159 5.32749 1.00159H146.675C147.243 1.00149 147.804 1.11305 148.328 1.3299C148.852 1.54675 149.329 1.86463 149.73 2.2654C150.131 2.66616 150.449 3.14195 150.666 3.66559C150.883 4.18923 150.995 4.75047 150.995 5.31723V39.6878H150.992Z" fill="white"/>%0D%0A<path d="M146.674 45H5.3275C3.91657 45 2.56326 44.4408 1.56449 43.445C0.565725 42.4493 0.00307811 41.0983 0 39.6885L0 5.31798C0.00230805 3.9074 0.564499 2.55532 1.56324 1.55835C2.56199 0.561391 3.91573 0.000959139 5.3275 0L146.673 0C148.084 0.00153388 149.437 0.562151 150.436 1.55899C151.435 2.55583 151.997 3.90757 152 5.31798V39.6871C151.997 41.0969 151.435 42.4481 150.437 43.4442C149.438 44.4403 148.085 44.9998 146.674 45Z" fill="%23A6A6A6"/>%0D%0A<path d="M150.99 39.6862C150.99 40.2525 150.878 40.8132 150.661 41.3362C150.444 41.8593 150.126 42.3346 149.725 42.7348C149.324 43.135 148.848 43.4524 148.325 43.6688C147.801 43.8852 147.24 43.9964 146.673 43.996H5.32505C4.17957 43.9974 3.08046 43.5441 2.2694 42.7359C1.45833 41.9277 1.00173 40.8307 1 39.6862V5.31565C1.00154 4.17053 1.45789 3.07284 2.26883 2.26367C3.07977 1.4545 4.17898 0.999999 5.32505 1H146.673C147.24 0.999905 147.802 1.11147 148.326 1.32831C148.85 1.54516 149.326 1.86305 149.727 2.26381C150.128 2.66457 150.447 3.14037 150.664 3.66401C150.881 4.18765 150.992 4.74888 150.992 5.31565V39.6862H150.99Z" fill="black"/>%0D%0A<path d="M32.9408 22.2627C32.9551 21.1623 33.2478 20.0834 33.7916 19.1264C34.3355 18.1694 35.1128 17.3655 36.0513 16.7894C35.4548 15.939 34.6681 15.2391 33.7537 14.7454C32.8392 14.2516 31.8223 13.9776 30.7834 13.945C28.5678 13.712 26.4184 15.2696 25.2895 15.2696C24.1382 15.2696 22.3999 13.9675 20.5265 14.0059C19.3155 14.0449 18.1352 14.3966 17.1007 15.0269C16.0663 15.6572 15.2128 16.5445 14.6236 17.6023C12.071 22.0167 13.975 28.5046 16.4208 32.0727C17.6441 33.8212 19.0736 35.7743 20.9449 35.7017C22.7754 35.6292 23.459 34.5404 25.6665 34.5404C27.8552 34.5404 28.4995 35.7017 30.4057 35.6611C32.367 35.6306 33.6069 33.9054 34.7881 32.1424C35.6682 30.8969 36.3452 29.5199 36.7937 28.0626C35.6538 27.5791 34.6813 26.7716 33.9968 25.7405C33.3124 24.7093 32.9462 23.5 32.9437 22.2627H32.9408ZM29.3356 11.5977C30.4069 10.3137 30.9346 8.66282 30.8066 6.99609C29.1705 7.16808 27.6592 7.94904 26.5731 9.18367C26.0422 9.78694 25.6357 10.4889 25.3766 11.2494C25.1176 12.0098 25.0113 12.8139 25.0636 13.6154C25.8821 13.624 26.6918 13.4469 27.4318 13.0974C28.1718 12.7478 28.8228 12.2351 29.3356 11.5977Z" fill="white"/>%0D%0A<path d="M47.1804 16H45.7827L48.9233 7.27273H50.4446L53.5852 16H52.1875L49.7202 8.85795H49.652L47.1804 16ZM47.4148 12.5824H51.9489V13.6903H47.4148V12.5824ZM57.3949 16.1321C56.7614 16.1321 56.2159 15.9886 55.7585 15.7017C55.304 15.4119 54.9545 15.0128 54.7102 14.5043C54.4659 13.9957 54.3438 13.4134 54.3438 12.7571C54.3438 12.0923 54.4688 11.5057 54.7188 10.9972C54.9688 10.4858 55.321 10.0866 55.7756 9.79972C56.2301 9.51278 56.7656 9.36932 57.3821 9.36932C57.8793 9.36932 58.3224 9.46165 58.7116 9.64631C59.1009 9.82812 59.4148 10.0838 59.6534 10.4134C59.8949 10.7429 60.0384 11.1278 60.0838 11.5682H58.8438C58.7756 11.2614 58.6193 10.9972 58.375 10.7756C58.1335 10.554 57.8097 10.4432 57.4034 10.4432C57.0483 10.4432 56.7372 10.5369 56.4702 10.7244C56.206 10.9091 56 11.1733 55.8523 11.517C55.7045 11.858 55.6307 12.2614 55.6307 12.7273C55.6307 13.2045 55.7031 13.6165 55.848 13.9631C55.9929 14.3097 56.1974 14.5781 56.4616 14.7685C56.7287 14.9588 57.0426 15.054 57.4034 15.054C57.6449 15.054 57.8636 15.0099 58.0597 14.9219C58.2585 14.831 58.4247 14.7017 58.5582 14.5341C58.6946 14.3665 58.7898 14.1648 58.8438 13.929H60.0838C60.0384 14.3523 59.9006 14.7301 59.6705 15.0625C59.4403 15.3949 59.1321 15.6562 58.7457 15.8466C58.3622 16.0369 57.9119 16.1321 57.3949 16.1321ZM64.2035 16.1321C63.57 16.1321 63.0245 15.9886 62.5671 15.7017C62.1126 15.4119 61.7631 15.0128 61.5188 14.5043C61.2745 13.9957 61.1523 13.4134 61.1523 12.7571C61.1523 12.0923 61.2773 11.5057 61.5273 10.9972C61.7773 10.4858 62.1296 10.0866 62.5842 9.79972C63.0387 9.51278 63.5742 9.36932 64.1907 9.36932C64.6879 9.36932 65.131 9.46165 65.5202 9.64631C65.9094 9.82812 66.2234 10.0838 66.462 10.4134C66.7035 10.7429 66.8469 11.1278 66.8924 11.5682H65.6523C65.5842 11.2614 65.4279 10.9972 65.1836 10.7756C64.9421 10.554 64.6183 10.4432 64.212 10.4432C63.8569 10.4432 63.5458 10.5369 63.2788 10.7244C63.0146 10.9091 62.8086 11.1733 62.6609 11.517C62.5131 11.858 62.4393 12.2614 62.4393 12.7273C62.4393 13.2045 62.5117 13.6165 62.6566 13.9631C62.8015 14.3097 63.006 14.5781 63.2702 14.7685C63.5373 14.9588 63.8512 15.054 64.212 15.054C64.4535 15.054 64.6722 15.0099 64.8683 14.9219C65.0671 14.831 65.2333 14.7017 65.3668 14.5341C65.5032 14.3665 65.5984 14.1648 65.6523 13.929H66.8924C66.8469 14.3523 66.7092 14.7301 66.479 15.0625C66.2489 15.3949 65.9407 15.6562 65.5543 15.8466C65.1708 16.0369 64.7205 16.1321 64.2035 16.1321ZM71.076 16.1321C70.4311 16.1321 69.8757 15.9943 69.4098 15.7188C68.9467 15.4403 68.5888 15.0497 68.3359 14.5469C68.0859 14.0412 67.9609 13.4489 67.9609 12.7699C67.9609 12.0994 68.0859 11.5085 68.3359 10.9972C68.5888 10.4858 68.9411 10.0866 69.3928 9.79972C69.8473 9.51278 70.3786 9.36932 70.9865 9.36932C71.3558 9.36932 71.7138 9.4304 72.0604 9.55256C72.407 9.67472 72.718 9.86648 72.9936 10.1278C73.2692 10.3892 73.4865 10.7287 73.6456 11.1463C73.8047 11.5611 73.8842 12.0653 73.8842 12.6591V13.1108H68.6811V12.1562H72.6357C72.6357 11.821 72.5675 11.5241 72.4311 11.2656C72.2947 11.0043 72.103 10.7983 71.8558 10.6477C71.6115 10.4972 71.3246 10.4219 70.995 10.4219C70.6371 10.4219 70.3246 10.5099 70.0575 10.6861C69.7933 10.8594 69.5888 11.0866 69.4439 11.3679C69.3018 11.6463 69.2308 11.9489 69.2308 12.2756V13.0213C69.2308 13.4588 69.3075 13.831 69.4609 14.1378C69.6172 14.4446 69.8345 14.679 70.1129 14.8409C70.3913 15 70.7166 15.0795 71.0888 15.0795C71.3303 15.0795 71.5504 15.0455 71.7493 14.9773C71.9482 14.9062 72.12 14.8011 72.2649 14.6619C72.4098 14.5227 72.5206 14.3509 72.5973 14.1463L73.8033 14.3636C73.7067 14.7187 73.5334 15.0298 73.2834 15.2969C73.0362 15.5611 72.7251 15.767 72.3501 15.9148C71.978 16.0597 71.5533 16.1321 71.076 16.1321ZM80.2028 11.0526L79.0479 11.2571C78.9996 11.1094 78.9229 10.9687 78.8178 10.8352C78.7156 10.7017 78.5763 10.5923 78.4002 10.5071C78.2241 10.4219 78.0039 10.3793 77.7397 10.3793C77.3789 10.3793 77.0778 10.4602 76.8363 10.6222C76.5948 10.7812 76.4741 10.9872 76.4741 11.2401C76.4741 11.4588 76.555 11.6349 76.717 11.7685C76.8789 11.902 77.1403 12.0114 77.5011 12.0966L78.5408 12.3352C79.1431 12.4744 79.592 12.6889 79.8874 12.9787C80.1829 13.2685 80.3306 13.6449 80.3306 14.108C80.3306 14.5 80.217 14.8494 79.9897 15.1562C79.7653 15.4602 79.4513 15.6989 79.0479 15.8722C78.6474 16.0455 78.1829 16.1321 77.6545 16.1321C76.9215 16.1321 76.3235 15.9759 75.8604 15.6634C75.3974 15.348 75.1133 14.9006 75.0082 14.321L76.2397 14.1335C76.3164 14.4545 76.4741 14.6974 76.7127 14.8622C76.9513 15.0241 77.2624 15.1051 77.646 15.1051C78.0636 15.1051 78.3974 15.0185 78.6474 14.8452C78.8974 14.669 79.0224 14.4545 79.0224 14.2017C79.0224 13.9972 78.9457 13.8253 78.7923 13.6861C78.6417 13.5469 78.4102 13.4418 78.0977 13.3707L76.9897 13.1278C76.3789 12.9886 75.9272 12.767 75.6346 12.4631C75.3448 12.1591 75.1999 11.7741 75.1999 11.3082C75.1999 10.9219 75.3079 10.5838 75.5238 10.294C75.7397 10.0043 76.038 9.77841 76.4187 9.61648C76.7994 9.4517 77.2354 9.36932 77.7269 9.36932C78.4343 9.36932 78.9911 9.52273 79.3974 9.82955C79.8036 10.1335 80.0721 10.5412 80.2028 11.0526ZM86.6364 11.0526L85.4815 11.2571C85.4332 11.1094 85.3565 10.9687 85.2514 10.8352C85.1491 10.7017 85.0099 10.5923 84.8338 10.5071C84.6577 10.4219 84.4375 10.3793 84.1733 10.3793C83.8125 10.3793 83.5114 10.4602 83.2699 10.6222C83.0284 10.7812 82.9077 10.9872 82.9077 11.2401C82.9077 11.4588 82.9886 11.6349 83.1506 11.7685C83.3125 11.902 83.5739 12.0114 83.9347 12.0966L84.9744 12.3352C85.5767 12.4744 86.0256 12.6889 86.321 12.9787C86.6165 13.2685 86.7642 13.6449 86.7642 14.108C86.7642 14.5 86.6506 14.8494 86.4233 15.1562C86.1989 15.4602 85.8849 15.6989 85.4815 15.8722C85.081 16.0455 84.6165 16.1321 84.0881 16.1321C83.3551 16.1321 82.7571 15.9759 82.294 15.6634C81.831 15.348 81.5469 14.9006 81.4418 14.321L82.6733 14.1335C82.75 14.4545 82.9077 14.6974 83.1463 14.8622C83.3849 15.0241 83.696 15.1051 84.0795 15.1051C84.4972 15.1051 84.831 15.0185 85.081 14.8452C85.331 14.669 85.456 14.4545 85.456 14.2017C85.456 13.9972 85.3793 13.8253 85.2259 13.6861C85.0753 13.5469 84.8438 13.4418 84.5312 13.3707L83.4233 13.1278C82.8125 12.9886 82.3608 12.767 82.0682 12.4631C81.7784 12.1591 81.6335 11.7741 81.6335 11.3082C81.6335 10.9219 81.7415 10.5838 81.9574 10.294C82.1733 10.0043 82.4716 9.77841 82.8523 9.61648C83.233 9.4517 83.669 9.36932 84.1605 9.36932C84.8679 9.36932 85.4247 9.52273 85.831 9.82955C86.2372 10.1335 86.5057 10.5412 86.6364 11.0526ZM93.152 16L90.7315 7.27273H92.1165L93.8168 14.0312H93.8977L95.6662 7.27273H97.0384L98.8068 14.0355H98.8878L100.584 7.27273H101.973L99.5483 16H98.223L96.3864 9.46307H96.3182L94.4815 16H93.152ZM105.248 16.1321C104.603 16.1321 104.048 15.9943 103.582 15.7188C103.119 15.4403 102.761 15.0497 102.508 14.5469C102.258 14.0412 102.133 13.4489 102.133 12.7699C102.133 12.0994 102.258 11.5085 102.508 10.9972C102.761 10.4858 103.113 10.0866 103.565 9.79972C104.019 9.51278 104.55 9.36932 105.158 9.36932C105.528 9.36932 105.886 9.4304 106.232 9.55256C106.579 9.67472 106.89 9.86648 107.165 10.1278C107.441 10.3892 107.658 10.7287 107.817 11.1463C107.977 11.5611 108.056 12.0653 108.056 12.6591V13.1108H102.853V12.1562H106.808C106.808 11.821 106.739 11.5241 106.603 11.2656C106.467 11.0043 106.275 10.7983 106.028 10.6477C105.783 10.4972 105.496 10.4219 105.167 10.4219C104.809 10.4219 104.496 10.5099 104.229 10.6861C103.965 10.8594 103.761 11.0866 103.616 11.3679C103.474 11.6463 103.403 11.9489 103.403 12.2756V13.0213C103.403 13.4588 103.479 13.831 103.633 14.1378C103.789 14.4446 104.006 14.679 104.285 14.8409C104.563 15 104.888 15.0795 105.261 15.0795C105.502 15.0795 105.722 15.0455 105.921 14.9773C106.12 14.9062 106.292 14.8011 106.437 14.6619C106.582 14.5227 106.692 14.3509 106.769 14.1463L107.975 14.3636C107.879 14.7187 107.705 15.0298 107.455 15.2969C107.208 15.5611 106.897 15.767 106.522 15.9148C106.15 16.0597 105.725 16.1321 105.248 16.1321ZM109.572 16V7.27273H110.846V10.5156H110.923C110.997 10.3793 111.103 10.2216 111.243 10.0426C111.382 9.86364 111.575 9.70739 111.822 9.57386C112.069 9.4375 112.396 9.36932 112.802 9.36932C113.331 9.36932 113.802 9.50284 114.217 9.76989C114.632 10.0369 114.957 10.4219 115.193 10.9247C115.431 11.4276 115.551 12.0327 115.551 12.7401C115.551 13.4474 115.433 14.054 115.197 14.5597C114.961 15.0625 114.637 15.4503 114.225 15.723C113.814 15.9929 113.343 16.1278 112.815 16.1278C112.417 16.1278 112.092 16.0611 111.839 15.9276C111.589 15.794 111.393 15.6378 111.251 15.4588C111.109 15.2798 111 15.1207 110.923 14.9815H110.816V16H109.572ZM110.821 12.7273C110.821 13.1875 110.887 13.5909 111.021 13.9375C111.154 14.2841 111.348 14.5554 111.6 14.7514C111.853 14.9446 112.163 15.0412 112.529 15.0412C112.91 15.0412 113.228 14.9403 113.484 14.7386C113.74 14.5341 113.933 14.2571 114.064 13.9077C114.197 13.5582 114.264 13.1648 114.264 12.7273C114.264 12.2955 114.199 11.9077 114.068 11.5639C113.94 11.2202 113.747 10.9489 113.488 10.75C113.233 10.5511 112.913 10.4517 112.529 10.4517C112.16 10.4517 111.848 10.5469 111.592 10.7372C111.339 10.9276 111.147 11.1932 111.017 11.5341C110.886 11.875 110.821 12.2727 110.821 12.7273ZM120.997 16H119.599L122.74 7.27273H124.261L127.402 16H126.004L123.537 8.85795H123.468L120.997 16ZM121.231 12.5824H125.765V13.6903H121.231V12.5824ZM128.56 18.4545V9.45455H129.804V10.5156H129.911C129.984 10.3793 130.091 10.2216 130.23 10.0426C130.369 9.86364 130.563 9.70739 130.81 9.57386C131.057 9.4375 131.384 9.36932 131.79 9.36932C132.318 9.36932 132.79 9.50284 133.205 9.76989C133.619 10.0369 133.945 10.4219 134.18 10.9247C134.419 11.4276 134.538 12.0327 134.538 12.7401C134.538 13.4474 134.42 14.054 134.185 14.5597C133.949 15.0625 133.625 15.4503 133.213 15.723C132.801 15.9929 132.331 16.1278 131.803 16.1278C131.405 16.1278 131.08 16.0611 130.827 15.9276C130.577 15.794 130.381 15.6378 130.239 15.4588C130.097 15.2798 129.987 15.1207 129.911 14.9815H129.834V18.4545H128.56ZM129.808 12.7273C129.808 13.1875 129.875 13.5909 130.009 13.9375C130.142 14.2841 130.335 14.5554 130.588 14.7514C130.841 14.9446 131.151 15.0412 131.517 15.0412C131.898 15.0412 132.216 14.9403 132.472 14.7386C132.727 14.5341 132.92 14.2571 133.051 13.9077C133.185 13.5582 133.251 13.1648 133.251 12.7273C133.251 12.2955 133.186 11.9077 133.055 11.5639C132.928 11.2202 132.734 10.9489 132.476 10.75C132.22 10.5511 131.901 10.4517 131.517 10.4517C131.148 10.4517 130.835 10.5469 130.58 10.7372C130.327 10.9276 130.135 11.1932 130.004 11.5341C129.874 11.875 129.808 12.2727 129.808 12.7273ZM135.966 18.4545V9.45455H137.21V10.5156H137.317C137.391 10.3793 137.497 10.2216 137.636 10.0426C137.776 9.86364 137.969 9.70739 138.216 9.57386C138.463 9.4375 138.79 9.36932 139.196 9.36932C139.724 9.36932 140.196 9.50284 140.611 9.76989C141.026 10.0369 141.351 10.4219 141.587 10.9247C141.825 11.4276 141.945 12.0327 141.945 12.7401C141.945 13.4474 141.827 14.054 141.591 14.5597C141.355 15.0625 141.031 15.4503 140.619 15.723C140.207 15.9929 139.737 16.1278 139.209 16.1278C138.811 16.1278 138.486 16.0611 138.233 15.9276C137.983 15.794 137.787 15.6378 137.645 15.4588C137.503 15.2798 137.393 15.1207 137.317 14.9815H137.24V18.4545H135.966ZM137.214 12.7273C137.214 13.1875 137.281 13.5909 137.415 13.9375C137.548 14.2841 137.741 14.5554 137.994 14.7514C138.247 14.9446 138.557 15.0412 138.923 15.0412C139.304 15.0412 139.622 14.9403 139.878 14.7386C140.134 14.5341 140.327 14.2571 140.457 13.9077C140.591 13.5582 140.658 13.1648 140.658 12.7273C140.658 12.2955 140.592 11.9077 140.462 11.5639C140.334 11.2202 140.141 10.9489 139.882 10.75C139.626 10.5511 139.307 10.4517 138.923 10.4517C138.554 10.4517 138.241 10.5469 137.986 10.7372C137.733 10.9276 137.541 11.1932 137.411 11.5341C137.28 11.875 137.214 12.2727 137.214 12.7273Z" fill="white"/>%0D%0A<path d="M46.8162 36V25.0909H48.9398V36H46.8162ZM47.8887 23.4077C47.5194 23.4077 47.2021 23.2846 46.937 23.0384C46.6766 22.7874 46.5463 22.4891 46.5463 22.1435C46.5463 21.7931 46.6766 21.4948 46.937 21.2486C47.2021 20.9976 47.5194 20.8722 47.8887 20.8722C48.258 20.8722 48.5729 20.9976 48.8333 21.2486C49.0984 21.4948 49.231 21.7931 49.231 22.1435C49.231 22.4891 49.0984 22.7874 48.8333 23.0384C48.5729 23.2846 48.258 23.4077 47.8887 23.4077ZM64.6021 28.7273C64.6021 30.2803 64.318 31.6155 63.7498 32.733C63.1816 33.8456 62.4028 34.7027 61.4132 35.304C60.4283 35.9006 59.3085 36.1989 58.0538 36.1989C56.7943 36.1989 55.6698 35.9006 54.6802 35.304C53.6954 34.7027 52.9189 33.8433 52.3507 32.7259C51.7825 31.6084 51.4984 30.2756 51.4984 28.7273C51.4984 27.1742 51.7825 25.8414 52.3507 24.7287C52.9189 23.6113 53.6954 22.7543 54.6802 22.1577C55.6698 21.5563 56.7943 21.2557 58.0538 21.2557C59.3085 21.2557 60.4283 21.5563 61.4132 22.1577C62.4028 22.7543 63.1816 23.6113 63.7498 24.7287C64.318 25.8414 64.6021 27.1742 64.6021 28.7273ZM62.4288 28.7273C62.4288 27.5436 62.237 26.5469 61.8535 25.7372C61.4747 24.9228 60.9539 24.3073 60.291 23.8906C59.6329 23.4692 58.8871 23.2585 58.0538 23.2585C57.2157 23.2585 56.4676 23.4692 55.8095 23.8906C55.1513 24.3073 54.6305 24.9228 54.247 25.7372C53.8682 26.5469 53.6788 27.5436 53.6788 28.7273C53.6788 29.911 53.8682 30.91 54.247 31.7244C54.6305 32.5341 55.1513 33.1496 55.8095 33.571C56.4676 33.9877 57.2157 34.196 58.0538 34.196C58.8871 34.196 59.6329 33.9877 60.291 33.571C60.9539 33.1496 61.4747 32.5341 61.8535 31.7244C62.237 30.91 62.4288 29.911 62.4288 28.7273ZM75.2715 25.2756C75.1957 24.6032 74.8832 24.0824 74.334 23.7131C73.7847 23.339 73.0935 23.152 72.2601 23.152C71.6635 23.152 71.1474 23.2467 70.7118 23.4361C70.2762 23.6207 69.9377 23.8764 69.6962 24.2031C69.4595 24.5251 69.3411 24.892 69.3411 25.304C69.3411 25.6496 69.4216 25.9479 69.5826 26.1989C69.7483 26.4498 69.9637 26.6605 70.2289 26.831C70.4988 26.9967 70.7876 27.1364 71.0953 27.25C71.4031 27.3589 71.699 27.4489 71.9831 27.5199L73.4036 27.8892C73.8676 28.0028 74.3435 28.1567 74.8311 28.3509C75.3188 28.545 75.771 28.8007 76.1877 29.1179C76.6043 29.4351 76.9405 29.8281 77.1962 30.2969C77.4566 30.7656 77.5868 31.3267 77.5868 31.9801C77.5868 32.804 77.3738 33.5355 76.9476 34.1747C76.5262 34.8139 75.9131 35.3182 75.1081 35.6875C74.3079 36.0568 73.3397 36.2415 72.2033 36.2415C71.1143 36.2415 70.1721 36.0687 69.3766 35.723C68.5811 35.3774 67.9585 34.8873 67.5087 34.2528C67.0589 33.6136 66.8103 32.8561 66.763 31.9801H68.9647C69.0073 32.5057 69.1777 32.9437 69.476 33.294C69.7791 33.6397 70.165 33.8977 70.6337 34.0682C71.1072 34.2339 71.6257 34.3168 72.1891 34.3168C72.8094 34.3168 73.361 34.2197 73.8439 34.0256C74.3316 33.8267 74.7151 33.5521 74.9945 33.2017C75.2739 32.8466 75.4135 32.4323 75.4135 31.9588C75.4135 31.5279 75.2904 31.1752 75.0442 30.9006C74.8027 30.6259 74.4737 30.3987 74.057 30.2188C73.6451 30.0388 73.1787 29.8802 72.6578 29.7429L70.9391 29.2741C69.7743 28.9569 68.851 28.4905 68.1692 27.875C67.4921 27.2595 67.1536 26.4451 67.1536 25.4318C67.1536 24.5937 67.3809 23.8622 67.8354 23.2372C68.29 22.6122 68.9055 22.1269 69.682 21.7812C70.4585 21.4309 71.3345 21.2557 72.3098 21.2557C73.2947 21.2557 74.1635 21.4285 74.9164 21.7741C75.6739 22.1198 76.2705 22.5956 76.7061 23.2017C77.1418 23.803 77.369 24.4943 77.388 25.2756H75.2715Z" fill="white"/>%0D%0A</g>%0D%0A<defs>%0D%0A<clipPath id="clip0_952_93">%0D%0A<rect width="152" height="45" fill="white"/>%0D%0A</clipPath>%0D%0A</defs>%0D%0A</svg>%0D%0A)
">%0D%0A<path d="M150.992 39.6878C150.992 40.2541 150.881 40.8147 150.664 41.3378C150.447 41.8609 150.128 42.3361 149.728 42.7364C149.327 43.1366 148.851 43.454 148.327 43.6704C147.803 43.8868 147.242 43.998 146.675 43.9976H5.32749C4.18202 43.999 3.0829 43.5457 2.27184 42.7375C1.46077 41.9293 1.00417 40.8323 1.00244 39.6878V5.31723C1.00398 4.17212 1.46033 3.07443 2.27127 2.26526C3.08221 1.45608 4.18142 1.00159 5.32749 1.00159H146.675C147.243 1.00149 147.804 1.11305 148.328 1.3299C148.852 1.54675 149.329 1.86463 149.73 2.2654C150.131 2.66616 150.449 3.14195 150.666 3.66559C150.883 4.18923 150.995 4.75047 150.995 5.31723V39.6878H150.992Z" fill="white"/>%0D%0A<path d="M146.674 45H5.3275C3.91657 45 2.56326 44.4408 1.56449 43.445C0.565725 42.4493 0.00307811 41.0983 0 39.6885L0 5.31798C0.00230805 3.9074 0.564499 2.55532 1.56324 1.55835C2.56199 0.561391 3.91573 0.000959139 5.3275 0L146.673 0C148.084 0.00153388 149.437 0.562151 150.436 1.55899C151.435 2.55583 151.997 3.90757 152 5.31798V39.6871C151.997 41.0969 151.435 42.4481 150.437 43.4442C149.438 44.4403 148.085 44.9998 146.674 45Z" fill="%23A6A6A6"/>%0D%0A<path d="M150.99 39.6862C150.99 40.2525 150.878 40.8132 150.661 41.3362C150.444 41.8593 150.126 42.3346 149.725 42.7348C149.324 43.135 148.848 43.4524 148.325 43.6688C147.801 43.8852 147.24 43.9964 146.673 43.996H5.32505C4.17957 43.9974 3.08046 43.5441 2.2694 42.7359C1.45833 41.9277 1.00173 40.8307 1 39.6862V5.31565C1.00154 4.17053 1.45789 3.07284 2.26883 2.26367C3.07977 1.4545 4.17898 0.999999 5.32505 1H146.673C147.24 0.999905 147.802 1.11147 148.326 1.32831C148.85 1.54516 149.326 1.86305 149.727 2.26381C150.128 2.66457 150.447 3.14037 150.664 3.66401C150.881 4.18765 150.992 4.74888 150.992 5.31565V39.6862H150.99Z" fill="black"/>%0D%0A<path d="M47.1804 16H45.7827L48.9233 7.27273H50.4446L53.5852 16H52.1875L49.7202 8.85795H49.652L47.1804 16ZM47.4148 12.5824H51.9489V13.6903H47.4148V12.5824ZM57.3949 16.1321C56.7614 16.1321 56.2159 15.9886 55.7585 15.7017C55.304 15.4119 54.9545 15.0128 54.7102 14.5043C54.4659 13.9957 54.3438 13.4134 54.3438 12.7571C54.3438 12.0923 54.4688 11.5057 54.7188 10.9972C54.9688 10.4858 55.321 10.0866 55.7756 9.79972C56.2301 9.51278 56.7656 9.36932 57.3821 9.36932C57.8793 9.36932 58.3224 9.46165 58.7116 9.64631C59.1009 9.82812 59.4148 10.0838 59.6534 10.4134C59.8949 10.7429 60.0384 11.1278 60.0838 11.5682H58.8438C58.7756 11.2614 58.6193 10.9972 58.375 10.7756C58.1335 10.554 57.8097 10.4432 57.4034 10.4432C57.0483 10.4432 56.7372 10.5369 56.4702 10.7244C56.206 10.9091 56 11.1733 55.8523 11.517C55.7045 11.858 55.6307 12.2614 55.6307 12.7273C55.6307 13.2045 55.7031 13.6165 55.848 13.9631C55.9929 14.3097 56.1974 14.5781 56.4616 14.7685C56.7287 14.9588 57.0426 15.054 57.4034 15.054C57.6449 15.054 57.8636 15.0099 58.0597 14.9219C58.2585 14.831 58.4247 14.7017 58.5582 14.5341C58.6946 14.3665 58.7898 14.1648 58.8438 13.929H60.0838C60.0384 14.3523 59.9006 14.7301 59.6705 15.0625C59.4403 15.3949 59.1321 15.6562 58.7457 15.8466C58.3622 16.0369 57.9119 16.1321 57.3949 16.1321ZM64.2035 16.1321C63.57 16.1321 63.0245 15.9886 62.5671 15.7017C62.1126 15.4119 61.7631 15.0128 61.5188 14.5043C61.2745 13.9957 61.1523 13.4134 61.1523 12.7571C61.1523 12.0923 61.2773 11.5057 61.5273 10.9972C61.7773 10.4858 62.1296 10.0866 62.5842 9.79972C63.0387 9.51278 63.5742 9.36932 64.1907 9.36932C64.6879 9.36932 65.131 9.46165 65.5202 9.64631C65.9094 9.82812 66.2234 10.0838 66.462 10.4134C66.7035 10.7429 66.8469 11.1278 66.8924 11.5682H65.6523C65.5842 11.2614 65.4279 10.9972 65.1836 10.7756C64.9421 10.554 64.6183 10.4432 64.212 10.4432C63.8569 10.4432 63.5458 10.5369 63.2788 10.7244C63.0146 10.9091 62.8086 11.1733 62.6609 11.517C62.5131 11.858 62.4393 12.2614 62.4393 12.7273C62.4393 13.2045 62.5117 13.6165 62.6566 13.9631C62.8015 14.3097 63.006 14.5781 63.2702 14.7685C63.5373 14.9588 63.8512 15.054 64.212 15.054C64.4535 15.054 64.6722 15.0099 64.8683 14.9219C65.0671 14.831 65.2333 14.7017 65.3668 14.5341C65.5032 14.3665 65.5984 14.1648 65.6523 13.929H66.8924C66.8469 14.3523 66.7092 14.7301 66.479 15.0625C66.2489 15.3949 65.9407 15.6562 65.5543 15.8466C65.1708 16.0369 64.7205 16.1321 64.2035 16.1321ZM71.076 16.1321C70.4311 16.1321 69.8757 15.9943 69.4098 15.7188C68.9467 15.4403 68.5888 15.0497 68.3359 14.5469C68.0859 14.0412 67.9609 13.4489 67.9609 12.7699C67.9609 12.0994 68.0859 11.5085 68.3359 10.9972C68.5888 10.4858 68.9411 10.0866 69.3928 9.79972C69.8473 9.51278 70.3786 9.36932 70.9865 9.36932C71.3558 9.36932 71.7138 9.4304 72.0604 9.55256C72.407 9.67472 72.718 9.86648 72.9936 10.1278C73.2692 10.3892 73.4865 10.7287 73.6456 11.1463C73.8047 11.5611 73.8842 12.0653 73.8842 12.6591V13.1108H68.6811V12.1562H72.6357C72.6357 11.821 72.5675 11.5241 72.4311 11.2656C72.2947 11.0043 72.103 10.7983 71.8558 10.6477C71.6115 10.4972 71.3246 10.4219 70.995 10.4219C70.6371 10.4219 70.3246 10.5099 70.0575 10.6861C69.7933 10.8594 69.5888 11.0866 69.4439 11.3679C69.3018 11.6463 69.2308 11.9489 69.2308 12.2756V13.0213C69.2308 13.4588 69.3075 13.831 69.4609 14.1378C69.6172 14.4446 69.8345 14.679 70.1129 14.8409C70.3913 15 70.7166 15.0795 71.0888 15.0795C71.3303 15.0795 71.5504 15.0455 71.7493 14.9773C71.9482 14.9062 72.12 14.8011 72.2649 14.6619C72.4098 14.5227 72.5206 14.3509 72.5973 14.1463L73.8033 14.3636C73.7067 14.7187 73.5334 15.0298 73.2834 15.2969C73.0362 15.5611 72.7251 15.767 72.3501 15.9148C71.978 16.0597 71.5533 16.1321 71.076 16.1321ZM80.2028 11.0526L79.0479 11.2571C78.9996 11.1094 78.9229 10.9687 78.8178 10.8352C78.7156 10.7017 78.5763 10.5923 78.4002 10.5071C78.2241 10.4219 78.0039 10.3793 77.7397 10.3793C77.3789 10.3793 77.0778 10.4602 76.8363 10.6222C76.5948 10.7812 76.4741 10.9872 76.4741 11.2401C76.4741 11.4588 76.555 11.6349 76.717 11.7685C76.8789 11.902 77.1403 12.0114 77.5011 12.0966L78.5408 12.3352C79.1431 12.4744 79.592 12.6889 79.8874 12.9787C80.1829 13.2685 80.3306 13.6449 80.3306 14.108C80.3306 14.5 80.217 14.8494 79.9897 15.1562C79.7653 15.4602 79.4513 15.6989 79.0479 15.8722C78.6474 16.0455 78.1829 16.1321 77.6545 16.1321C76.9215 16.1321 76.3235 15.9759 75.8604 15.6634C75.3974 15.348 75.1133 14.9006 75.0082 14.321L76.2397 14.1335C76.3164 14.4545 76.4741 14.6974 76.7127 14.8622C76.9513 15.0241 77.2624 15.1051 77.646 15.1051C78.0636 15.1051 78.3974 15.0185 78.6474 14.8452C78.8974 14.669 79.0224 14.4545 79.0224 14.2017C79.0224 13.9972 78.9457 13.8253 78.7923 13.6861C78.6417 13.5469 78.4102 13.4418 78.0977 13.3707L76.9897 13.1278C76.3789 12.9886 75.9272 12.767 75.6346 12.4631C75.3448 12.1591 75.1999 11.7741 75.1999 11.3082C75.1999 10.9219 75.3079 10.5838 75.5238 10.294C75.7397 10.0043 76.038 9.77841 76.4187 9.61648C76.7994 9.4517 77.2354 9.36932 77.7269 9.36932C78.4343 9.36932 78.9911 9.52273 79.3974 9.82955C79.8036 10.1335 80.0721 10.5412 80.2028 11.0526ZM86.6364 11.0526L85.4815 11.2571C85.4332 11.1094 85.3565 10.9687 85.2514 10.8352C85.1491 10.7017 85.0099 10.5923 84.8338 10.5071C84.6577 10.4219 84.4375 10.3793 84.1733 10.3793C83.8125 10.3793 83.5114 10.4602 83.2699 10.6222C83.0284 10.7812 82.9077 10.9872 82.9077 11.2401C82.9077 11.4588 82.9886 11.6349 83.1506 11.7685C83.3125 11.902 83.5739 12.0114 83.9347 12.0966L84.9744 12.3352C85.5767 12.4744 86.0256 12.6889 86.321 12.9787C86.6165 13.2685 86.7642 13.6449 86.7642 14.108C86.7642 14.5 86.6506 14.8494 86.4233 15.1562C86.1989 15.4602 85.8849 15.6989 85.4815 15.8722C85.081 16.0455 84.6165 16.1321 84.0881 16.1321C83.3551 16.1321 82.7571 15.9759 82.294 15.6634C81.831 15.348 81.5469 14.9006 81.4418 14.321L82.6733 14.1335C82.75 14.4545 82.9077 14.6974 83.1463 14.8622C83.3849 15.0241 83.696 15.1051 84.0795 15.1051C84.4972 15.1051 84.831 15.0185 85.081 14.8452C85.331 14.669 85.456 14.4545 85.456 14.2017C85.456 13.9972 85.3793 13.8253 85.2259 13.6861C85.0753 13.5469 84.8438 13.4418 84.5312 13.3707L83.4233 13.1278C82.8125 12.9886 82.3608 12.767 82.0682 12.4631C81.7784 12.1591 81.6335 11.7741 81.6335 11.3082C81.6335 10.9219 81.7415 10.5838 81.9574 10.294C82.1733 10.0043 82.4716 9.77841 82.8523 9.61648C83.233 9.4517 83.669 9.36932 84.1605 9.36932C84.8679 9.36932 85.4247 9.52273 85.831 9.82955C86.2372 10.1335 86.5057 10.5412 86.6364 11.0526ZM93.152 16L90.7315 7.27273H92.1165L93.8168 14.0312H93.8977L95.6662 7.27273H97.0384L98.8068 14.0355H98.8878L100.584 7.27273H101.973L99.5483 16H98.223L96.3864 9.46307H96.3182L94.4815 16H93.152ZM105.248 16.1321C104.603 16.1321 104.048 15.9943 103.582 15.7188C103.119 15.4403 102.761 15.0497 102.508 14.5469C102.258 14.0412 102.133 13.4489 102.133 12.7699C102.133 12.0994 102.258 11.5085 102.508 10.9972C102.761 10.4858 103.113 10.0866 103.565 9.79972C104.019 9.51278 104.55 9.36932 105.158 9.36932C105.528 9.36932 105.886 9.4304 106.232 9.55256C106.579 9.67472 106.89 9.86648 107.165 10.1278C107.441 10.3892 107.658 10.7287 107.817 11.1463C107.977 11.5611 108.056 12.0653 108.056 12.6591V13.1108H102.853V12.1562H106.808C106.808 11.821 106.739 11.5241 106.603 11.2656C106.467 11.0043 106.275 10.7983 106.028 10.6477C105.783 10.4972 105.496 10.4219 105.167 10.4219C104.809 10.4219 104.496 10.5099 104.229 10.6861C103.965 10.8594 103.761 11.0866 103.616 11.3679C103.474 11.6463 103.403 11.9489 103.403 12.2756V13.0213C103.403 13.4588 103.479 13.831 103.633 14.1378C103.789 14.4446 104.006 14.679 104.285 14.8409C104.563 15 104.888 15.0795 105.261 15.0795C105.502 15.0795 105.722 15.0455 105.921 14.9773C106.12 14.9062 106.292 14.8011 106.437 14.6619C106.582 14.5227 106.692 14.3509 106.769 14.1463L107.975 14.3636C107.879 14.7187 107.705 15.0298 107.455 15.2969C107.208 15.5611 106.897 15.767 106.522 15.9148C106.15 16.0597 105.725 16.1321 105.248 16.1321ZM109.572 16V7.27273H110.846V10.5156H110.923C110.997 10.3793 111.103 10.2216 111.243 10.0426C111.382 9.86364 111.575 9.70739 111.822 9.57386C112.069 9.4375 112.396 9.36932 112.802 9.36932C113.331 9.36932 113.802 9.50284 114.217 9.76989C114.632 10.0369 114.957 10.4219 115.193 10.9247C115.431 11.4276 115.551 12.0327 115.551 12.7401C115.551 13.4474 115.433 14.054 115.197 14.5597C114.961 15.0625 114.637 15.4503 114.225 15.723C113.814 15.9929 113.343 16.1278 112.815 16.1278C112.417 16.1278 112.092 16.0611 111.839 15.9276C111.589 15.794 111.393 15.6378 111.251 15.4588C111.109 15.2798 111 15.1207 110.923 14.9815H110.816V16H109.572ZM110.821 12.7273C110.821 13.1875 110.887 13.5909 111.021 13.9375C111.154 14.2841 111.348 14.5554 111.6 14.7514C111.853 14.9446 112.163 15.0412 112.529 15.0412C112.91 15.0412 113.228 14.9403 113.484 14.7386C113.74 14.5341 113.933 14.2571 114.064 13.9077C114.197 13.5582 114.264 13.1648 114.264 12.7273C114.264 12.2955 114.199 11.9077 114.068 11.5639C113.94 11.2202 113.747 10.9489 113.488 10.75C113.233 10.5511 112.913 10.4517 112.529 10.4517C112.16 10.4517 111.848 10.5469 111.592 10.7372C111.339 10.9276 111.147 11.1932 111.017 11.5341C110.886 11.875 110.821 12.2727 110.821 12.7273ZM120.997 16H119.599L122.74 7.27273H124.261L127.402 16H126.004L123.537 8.85795H123.468L120.997 16ZM121.231 12.5824H125.765V13.6903H121.231V12.5824ZM128.56 18.4545V9.45455H129.804V10.5156H129.911C129.984 10.3793 130.091 10.2216 130.23 10.0426C130.369 9.86364 130.563 9.70739 130.81 9.57386C131.057 9.4375 131.384 9.36932 131.79 9.36932C132.318 9.36932 132.79 9.50284 133.205 9.76989C133.619 10.0369 133.945 10.4219 134.18 10.9247C134.419 11.4276 134.538 12.0327 134.538 12.7401C134.538 13.4474 134.42 14.054 134.185 14.5597C133.949 15.0625 133.625 15.4503 133.213 15.723C132.801 15.9929 132.331 16.1278 131.803 16.1278C131.405 16.1278 131.08 16.0611 130.827 15.9276C130.577 15.794 130.381 15.6378 130.239 15.4588C130.097 15.2798 129.987 15.1207 129.911 14.9815H129.834V18.4545H128.56ZM129.808 12.7273C129.808 13.1875 129.875 13.5909 130.009 13.9375C130.142 14.2841 130.335 14.5554 130.588 14.7514C130.841 14.9446 131.151 15.0412 131.517 15.0412C131.898 15.0412 132.216 14.9403 132.472 14.7386C132.727 14.5341 132.92 14.2571 133.051 13.9077C133.185 13.5582 133.251 13.1648 133.251 12.7273C133.251 12.2955 133.186 11.9077 133.055 11.5639C132.928 11.2202 132.734 10.9489 132.476 10.75C132.22 10.5511 131.901 10.4517 131.517 10.4517C131.148 10.4517 130.835 10.5469 130.58 10.7372C130.327 10.9276 130.135 11.1932 130.004 11.5341C129.874 11.875 129.808 12.2727 129.808 12.7273ZM135.966 18.4545V9.45455H137.21V10.5156H137.317C137.391 10.3793 137.497 10.2216 137.636 10.0426C137.776 9.86364 137.969 9.70739 138.216 9.57386C138.463 9.4375 138.79 9.36932 139.196 9.36932C139.724 9.36932 140.196 9.50284 140.611 9.76989C141.026 10.0369 141.351 10.4219 141.587 10.9247C141.825 11.4276 141.945 12.0327 141.945 12.7401C141.945 13.4474 141.827 14.054 141.591 14.5597C141.355 15.0625 141.031 15.4503 140.619 15.723C140.207 15.9929 139.737 16.1278 139.209 16.1278C138.811 16.1278 138.486 16.0611 138.233 15.9276C137.983 15.794 137.787 15.6378 137.645 15.4588C137.503 15.2798 137.393 15.1207 137.317 14.9815H137.24V18.4545H135.966ZM137.214 12.7273C137.214 13.1875 137.281 13.5909 137.415 13.9375C137.548 14.2841 137.741 14.5554 137.994 14.7514C138.247 14.9446 138.557 15.0412 138.923 15.0412C139.304 15.0412 139.622 14.9403 139.878 14.7386C140.134 14.5341 140.327 14.2571 140.457 13.9077C140.591 13.5582 140.658 13.1648 140.658 12.7273C140.658 12.2955 140.592 11.9077 140.462 11.5639C140.334 11.2202 140.141 10.9489 139.882 10.75C139.626 10.5511 139.307 10.4517 138.923 10.4517C138.554 10.4517 138.241 10.5469 137.986 10.7372C137.733 10.9276 137.541 11.1932 137.411 11.5341C137.28 11.875 137.214 12.2727 137.214 12.7273Z" fill="white"/>%0D%0A<path d="M48.1705 36H45.8409L51.0753 21.4545H53.6108L58.8452 36H56.5156L52.4034 24.0966H52.2898L48.1705 36ZM48.5611 30.304H56.1179V32.1506H48.5611V30.304ZM62.8988 29.5227V36H60.7752V25.0909H62.8136V26.8665H62.9485C63.1995 26.2888 63.5924 25.8248 64.1275 25.4744C64.6673 25.1241 65.3467 24.9489 66.1658 24.9489C66.9092 24.9489 67.5603 25.1051 68.119 25.4176C68.6777 25.7254 69.1109 26.1847 69.4187 26.7955C69.7264 27.4062 69.8803 28.1615 69.8803 29.0611V36H67.7567V29.3168C67.7567 28.526 67.5508 27.9081 67.1388 27.4631C66.7269 27.0133 66.1611 26.7884 65.4414 26.7884C64.949 26.7884 64.511 26.8949 64.1275 27.108C63.7487 27.321 63.448 27.6335 63.2255 28.0455C63.0077 28.4527 62.8988 28.9451 62.8988 29.5227ZM76.8121 36.2131C75.9315 36.2131 75.1455 35.9882 74.4542 35.5384C73.7676 35.0838 73.2279 34.4375 72.8349 33.5994C72.4466 32.7566 72.2525 31.7457 72.2525 30.5668C72.2525 29.3878 72.449 28.3793 72.842 27.5412C73.2397 26.7031 73.7842 26.0616 74.4755 25.6165C75.1668 25.1714 75.9504 24.9489 76.8263 24.9489C77.5034 24.9489 78.0479 25.0625 78.4599 25.2898C78.8765 25.5123 79.1985 25.7727 79.4258 26.071C79.6578 26.3693 79.8377 26.6321 79.9656 26.8594H80.0934V21.4545H82.217V36H80.1431V34.3026H79.9656C79.8377 34.5346 79.6531 34.7997 79.4116 35.098C79.1748 35.3963 78.8481 35.6567 78.4315 35.8793C78.0148 36.1018 77.475 36.2131 76.8121 36.2131ZM77.2809 34.402C77.8917 34.402 78.4078 34.241 78.8292 33.919C79.2553 33.5923 79.5773 33.1402 79.7951 32.5625C80.0176 31.9848 80.1289 31.3125 80.1289 30.5455C80.1289 29.7879 80.02 29.125 79.8022 28.5568C79.5844 27.9886 79.2648 27.5459 78.8434 27.2287C78.422 26.9115 77.9012 26.7528 77.2809 26.7528C76.6417 26.7528 76.109 26.9186 75.6829 27.25C75.2567 27.5814 74.9348 28.0336 74.717 28.6065C74.5039 29.1795 74.3974 29.8258 74.3974 30.5455C74.3974 31.2746 74.5063 31.9304 74.7241 32.5128C74.9419 33.0952 75.2638 33.5568 75.69 33.8977C76.1209 34.2339 76.6512 34.402 77.2809 34.402ZM85.2479 36V25.0909H87.3004V26.8239H87.4141C87.6129 26.2367 87.9633 25.7751 88.4652 25.4389C88.9718 25.098 89.5447 24.9276 90.1839 24.9276C90.3165 24.9276 90.4728 24.9323 90.6527 24.9418C90.8374 24.9512 90.9818 24.9631 91.0859 24.9773V27.0085C91.0007 26.9848 90.8492 26.9588 90.6314 26.9304C90.4136 26.8973 90.1958 26.8807 89.978 26.8807C89.4761 26.8807 89.0286 26.9872 88.6357 27.2003C88.2474 27.4086 87.9396 27.6998 87.7124 28.0739C87.4851 28.4432 87.3714 28.8646 87.3714 29.3381V36H85.2479ZM97.1282 36.2202C96.1055 36.2202 95.2129 35.9858 94.4506 35.517C93.6883 35.0483 93.0965 34.3925 92.6751 33.5497C92.2537 32.7069 92.043 31.7221 92.043 30.5952C92.043 29.4635 92.2537 28.474 92.6751 27.6264C93.0965 26.7789 93.6883 26.1207 94.4506 25.652C95.2129 25.1832 96.1055 24.9489 97.1282 24.9489C98.1509 24.9489 99.0434 25.1832 99.8058 25.652C100.568 26.1207 101.16 26.7789 101.581 27.6264C102.003 28.474 102.213 29.4635 102.213 30.5952C102.213 31.7221 102.003 32.7069 101.581 33.5497C101.16 34.3925 100.568 35.0483 99.8058 35.517C99.0434 35.9858 98.1509 36.2202 97.1282 36.2202ZM97.1353 34.4375C97.7982 34.4375 98.3474 34.2623 98.783 33.9119C99.2186 33.5616 99.5406 33.0952 99.7489 32.5128C99.962 31.9304 100.069 31.2888 100.069 30.5881C100.069 29.892 99.962 29.2528 99.7489 28.6705C99.5406 28.0833 99.2186 27.6122 98.783 27.2571C98.3474 26.902 97.7982 26.7244 97.1353 26.7244C96.4677 26.7244 95.9137 26.902 95.4734 27.2571C95.0378 27.6122 94.7134 28.0833 94.5004 28.6705C94.292 29.2528 94.1879 29.892 94.1879 30.5881C94.1879 31.2888 94.292 31.9304 94.5004 32.5128C94.7134 33.0952 95.0378 33.5616 95.4734 33.9119C95.9137 34.2623 96.4677 34.4375 97.1353 34.4375ZM104.584 36V25.0909H106.707V36H104.584ZM105.656 23.4077C105.287 23.4077 104.97 23.2846 104.705 23.0384C104.444 22.7874 104.314 22.4891 104.314 22.1435C104.314 21.7931 104.444 21.4948 104.705 21.2486C104.97 20.9976 105.287 20.8722 105.656 20.8722C106.026 20.8722 106.34 20.9976 106.601 21.2486C106.866 21.4948 106.999 21.7931 106.999 22.1435C106.999 22.4891 106.866 22.7874 106.601 23.0384C106.34 23.2846 106.026 23.4077 105.656 23.4077ZM113.648 36.2131C112.767 36.2131 111.981 35.9882 111.29 35.5384C110.604 35.0838 110.064 34.4375 109.671 33.5994C109.283 32.7566 109.088 31.7457 109.088 30.5668C109.088 29.3878 109.285 28.3793 109.678 27.5412C110.076 26.7031 110.62 26.0616 111.311 25.6165C112.003 25.1714 112.786 24.9489 113.662 24.9489C114.339 24.9489 114.884 25.0625 115.296 25.2898C115.712 25.5123 116.034 25.7727 116.262 26.071C116.494 26.3693 116.674 26.6321 116.801 26.8594H116.929V21.4545H119.053V36H116.979V34.3026H116.801C116.674 34.5346 116.489 34.7997 116.248 35.098C116.011 35.3963 115.684 35.6567 115.267 35.8793C114.851 36.1018 114.311 36.2131 113.648 36.2131ZM114.117 34.402C114.728 34.402 115.244 34.241 115.665 33.919C116.091 33.5923 116.413 33.1402 116.631 32.5625C116.854 31.9848 116.965 31.3125 116.965 30.5455C116.965 29.7879 116.856 29.125 116.638 28.5568C116.42 27.9886 116.101 27.5459 115.679 27.2287C115.258 26.9115 114.737 26.7528 114.117 26.7528C113.478 26.7528 112.945 26.9186 112.519 27.25C112.093 27.5814 111.771 28.0336 111.553 28.6065C111.34 29.1795 111.233 29.8258 111.233 30.5455C111.233 31.2746 111.342 31.9304 111.56 32.5128C111.778 33.0952 112.1 33.5568 112.526 33.8977C112.957 34.2339 113.487 34.402 114.117 34.402Z" fill="white"/>%0D%0A<g clip-path="url(%23clip1_4941_87)">%0D%0A<mask id="mask0_4941_87" style="mask-type:luminance" maskUnits="userSpaceOnUse" x="11" y="6" width="26" height="31">%0D%0A<path d="M37 6H11V37H37V6Z" fill="white"/>%0D%0A</mask>%0D%0A<g mask="url(%23mask0_4941_87)">%0D%0A<path d="M18.5897 6.23179L20.0249 8.74205C17.4125 10.0313 15.6416 12.5558 15.6416 15.4513H32.358C32.358 12.5558 30.5875 10.0317 27.9747 8.74205L29.4081 6.23179C29.4272 6.19602 29.4315 6.15417 29.4202 6.11523C29.4089 6.07628 29.3829 6.04334 29.3477 6.02349C29.3118 6.00329 29.2696 5.99752 29.2296 6.00735C29.1896 6.01717 29.1548 6.04186 29.1322 6.07645L27.6769 8.6091C26.5181 8.09621 25.2661 7.83135 24.0002 7.83135C22.7343 7.83135 21.4822 8.09621 20.3235 8.6091L18.8657 6.07645C18.8443 6.04144 18.8101 6.01625 18.7705 6.00628C18.7309 5.99631 18.6889 6.00236 18.6537 6.02313C18.6183 6.04285 18.5918 6.0756 18.5799 6.1145C18.568 6.1534 18.5715 6.19544 18.5897 6.23179ZM20.0249 11.0945C20.2357 11.0948 20.4377 11.1791 20.5868 11.329C20.7358 11.479 20.8196 11.6822 20.8199 11.8943C20.8199 12.1064 20.7362 12.3098 20.5871 12.4598C20.438 12.6098 20.2358 12.694 20.0249 12.694C19.8141 12.694 19.6119 12.6098 19.4628 12.4598C19.3137 12.3098 19.23 12.1064 19.23 11.8943C19.2303 11.6823 19.3142 11.4791 19.4632 11.3291C19.6122 11.1792 19.8142 11.0949 20.0249 11.0945ZM27.9747 11.0945C28.1855 11.0948 28.3875 11.1791 28.5365 11.329C28.6856 11.479 28.7694 11.6822 28.7697 11.8943C28.7697 12.1064 28.6859 12.3098 28.5368 12.4598C28.3878 12.6098 28.1855 12.694 27.9747 12.694C27.7639 12.694 27.5617 12.6098 27.4126 12.4598C27.2635 12.3098 27.1797 12.1064 27.1797 11.8943C27.1801 11.6823 27.264 11.4791 27.413 11.3291C27.562 11.1792 27.764 11.0949 27.9747 11.0945Z" fill="%23A4C639"/>%0D%0A<path d="M15.5745 16.4307V29.1892C15.5745 29.8223 16.3348 30.6508 16.9641 30.6508H18.9533V35.0006C18.9284 35.5056 19.1039 35.9999 19.4411 36.3749C19.7783 36.7498 20.2497 36.9747 20.7517 37.0001C21.0006 36.9879 21.2446 36.9265 21.4698 36.8194C21.6951 36.7123 21.8972 36.5616 22.0645 36.376C22.2318 36.1903 22.3612 35.9732 22.4451 35.7372C22.529 35.5013 22.5659 35.2509 22.5537 35.0006V30.6508H25.4463V35.0006C25.4215 35.5058 25.5972 36.0003 25.9347 36.3752C26.2722 36.7502 26.744 36.9749 27.2461 37.0001C27.7491 36.975 28.2217 36.7506 28.5607 36.3759C28.8996 36.0012 29.0773 35.5067 29.0548 35.0006V30.6508H31.0334C31.663 30.6508 32.4234 29.8223 32.4234 29.1892V16.4307H15.5745Z" fill="%23A4C639"/>%0D%0A<path d="M12.8019 16.1637C13.304 16.1895 13.7755 16.4144 14.1132 16.7891C14.4509 17.1638 14.6273 17.6579 14.6038 18.1631V25.7344C14.6272 26.2396 14.4507 26.7336 14.113 27.1083C13.7754 27.483 13.3039 27.7079 12.8019 27.7339C12.2995 27.7079 11.8279 27.4828 11.4902 27.1078C11.1525 26.7328 10.9762 26.2385 10.9999 25.733V18.1617C10.9766 17.6565 11.153 17.1625 11.4907 16.7878C11.8284 16.4131 12.2998 16.1882 12.8019 16.1622" fill="%23A4C639"/>%0D%0A<path d="M35.1984 16.1637C35.7005 16.1897 36.1719 16.4146 36.5096 16.7893C36.8472 17.164 37.0237 17.6579 37.0003 18.1632V25.7345C37.0242 25.987 36.9954 26.2417 36.9157 26.4824C36.836 26.7231 36.7071 26.9443 36.5375 27.132C36.3679 27.3197 36.1611 27.4696 35.9305 27.5722C35.6999 27.6748 35.4505 27.7278 35.1984 27.7278C34.9462 27.7278 34.6969 27.6748 34.4663 27.5722C34.2357 27.4696 34.0289 27.3197 33.8593 27.132C33.6896 26.9443 33.5608 26.7231 33.4811 26.4824C33.4014 26.2417 33.3726 25.987 33.3964 25.7345V18.1632C33.3731 17.6579 33.5495 17.164 33.8872 16.7893C34.2249 16.4146 34.6963 16.1897 35.1984 16.1637Z" fill="%23A4C639"/>%0D%0A</g>%0D%0A</g>%0D%0A</g>%0D%0A<defs>%0D%0A<clipPath id="clip0_4941_87">%0D%0A<rect width="152" height="45" fill="white"/>%0D%0A</clipPath>%0D%0A<clipPath id="clip1_4941_87">%0D%0A<rect width="26" height="31" fill="white" transform="translate(11 6)"/>%0D%0A</clipPath>%0D%0A</defs>%0D%0A</svg>%0D%0A)