Quick Links
USD/JPY Breaks 162 — Highest Since 1986: Leverage Playbook for Yen Shorts, Intervention Risk & Cross-Asset Fallout
Data Snapshot
Key Takeaways
- •USD/JPY at 162.70 is the weakest yen since 1986, confirmed by live market data and multiple sources — not a rumor.
- •Leveraged longs face asymmetric risk: carry momentum supports gradual upside, but MOF intervention can produce 200–400 pip gaps in minutes, triggering liquidations at >100x leverage.
- •BoJ at 1.00% and the Fed's hawkish dot plot sustain wide yield differentials — the core carry trade driver — but any softening in US PCE or a Tokyo CPI beat could rapidly narrow spreads.
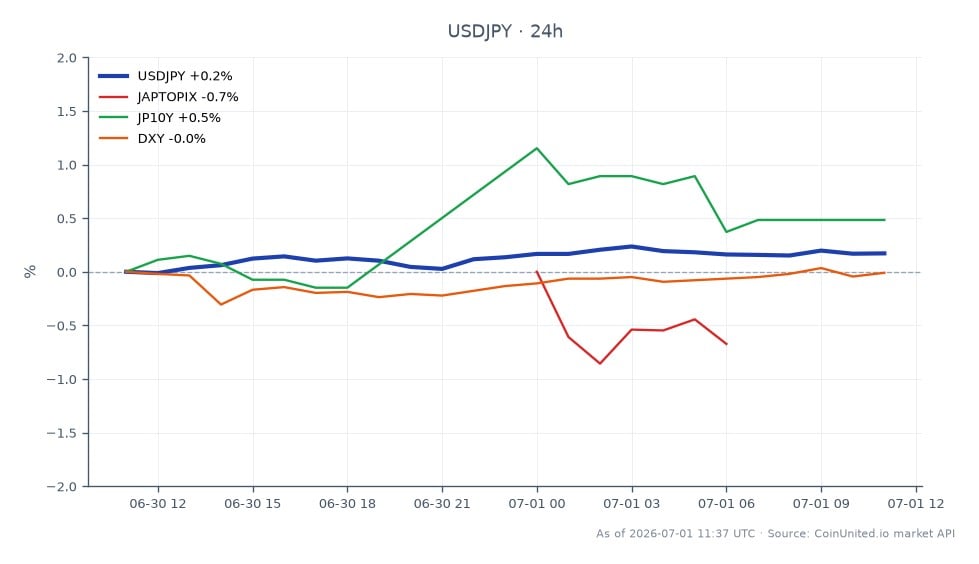
- •Cross-market: Nikkei 225 and TOPIX benefit near-term from yen weakness; Gold faces DXY headwinds; JPY intervention risk would trigger a broad USD unwind across all correlated pairs.
- •Key levels to watch: 162.85 resistance (24h high), 160.50 and 158.00 as intervention/reversal supports.
According to TradingEconomics and Wise historical data, USD/JPY surged past 162 on June 30, 2026, touching a weekly high of 162.645 — the weakest yen since late 1986. The current live price sits at 16
Event Summary
According to TradingEconomics and Wise historical data, USD/JPY surged past 162 on June 30, 2026, touching a weekly high of 162.645 — the weakest yen since late 1986. The current live price sits at 162.70, with a 24-hour range of 162.53–162.84. The pair broke its 2024 cycle high of ~161.95, clearing the key technical trigger that confirmed a multi-decade breakout.
The driver is a widening policy divergence: the Fed's hawkish dot plot holds US rates elevated while the Bank of Japan, despite hiking to 1.00%, has signaled only cautious normalization. As reported by InvestingLive, USD/JPY is "struggling to break through" cycle highs due to intervention fears — with Tokyo's Ministry of Finance watching disorderly moves closely. The 1986 peak reference is 168.35, per Macrotrends, providing the upper historical ceiling.
Leverage Impact Analysis
For leveraged USD/JPY positions, the current zone is a high-reward, high-risk environment — and leverage amplifies both.
Long scenario (USD/JPY long at 162.70): A trader using 100x leverage on a standard lot sees each 10-pip move (~0.06%) swing position value by ~6%. If USD/JPY extends to 163.50 (+80 pips), a 100x long yields approximately +4.9% on notional — substantial. But a single MOF intervention announcement can spike JPY 200–400 pips in minutes. At 100x, a 150-pip adverse move (~0.09%) against a long would trigger margin pressure; at 200x, the liquidation threshold compresses to under 80 pips.
Short scenario (intervention play): Traders positioning for a BoJ/MOF response — targeting a reversal toward 160.50 or 158.00 — face the risk that carry momentum continues to grind higher before any official action. Historical Japanese yen intervention episodes show initial spikes of 3–5 yen, but timing is unpredictable. High leverage on JPY shorts (long USD/JPY) must be sized with explicit stop discipline above 162.85 or the 24h high.
This is a textbook case where the Fed & ECB policy divergence repricing theme drives carry, but tail risk — intervention — is a non-linear, binary event. Reduce leverage near multi-decade highs; monitor position sizing relative to intervention gap risk.
Cross-Market Impact
Nikkei 225 & TOPIX: A weaker yen mechanically boosts Japanese exporter earnings (autos, electronics). The Nikkei 225 and Japan TOPIX may see near-term support, but any sharp intervention-driven JPY rally reverses this instantly — export earnings guidance becomes a liability.
DXY & USD pairs: The U.S. Dollar Currency Index benefits broadly from JPY weakness. EUR/USD and GBP/USD face headwinds as the dollar remains bid. The Fed macro policy crossroads theme — hawkish dot plot, firm PCE, stable labor — keeps this dynamic intact unless US data disappoints.
Gold: JPY weakness is dollar-strength. The gold vs. US dollar inverse relationship means XAU/USD faces headwinds while DXY stays elevated. Watch for a shift if intervention triggers a broad USD unwind.
Bitcoin: Indirect impact only. A global carry unwind — if intervention triggers a risk-off spike — could briefly pressure speculative assets including BTC via liquidity channels.
Trading Considerations
Key resistance: 162.65–162.84 (current 24h range top). A sustained break opens the path toward 163.50–164.00, with the 1986 historical peak at 168.35 as the macro ceiling. Key support on a reversal: 160.50, then 158.00 — levels cited by InvestingLive as intervention/macro-reversal targets.
Near-term catalysts: US PCE inflation and Jobless Claims on the US side; Tokyo CPI on the Japan side. Stronger Japanese inflation would raise BoJ tightening expectations — a direct JPY-positive catalyst. Softer US data narrows rate differentials, compressing the carry trade. Monitor Japan 10Y yield for any JGB market signals that could precede a BoJ policy shift.
Trade US Dollar / Japanese Yen on CoinUnited.io
Trade USDJPY with up to 2000xx leverage → | Create Free Account
Frequently Asked Questions
Given MOF intervention risk — which can produce 200–400 pip gaps in minutes — most risk managers cap leverage at 20–50x near multi-decade highs. At 100x, a 150-pip adverse move creates significant margin pressure; at 200x, liquidation can trigger in under 80 pips.
Continue Exploring
Disclaimer: This brief is for educational purposes only and is not investment advice.