Quick Links
Bitcoin's $60,000 Line in the Sand: Liquidation Risk, 200-Week MA, and What the CPI Print Decides
Data Snapshot
Key Takeaways
- •BTC is trading at $62,529, just 4% above the $60,000 200-week MA — the most technically significant support in this cycle's correction.
- •100x leveraged long positions opened near current price face liquidation within the already-tested intraday range ($61,876 low), making leverage sizing the critical risk variable.
- •A breakdown below $60,000 targets $57,000 (September 2024 levels), while a hold and reclaim of mid-$65,000s would signal correction exhaustion.
- •ETF outflows and institutional selling are net-negative near-term flow drivers — amplifying support level importance.
- •The US CPI print is the cross-market binary: hot data = USD strength + BTC breakdown + risk-off in equities; soft data = potential bounce and relief rally across risk assets including MSTR, COIN, and MARA.
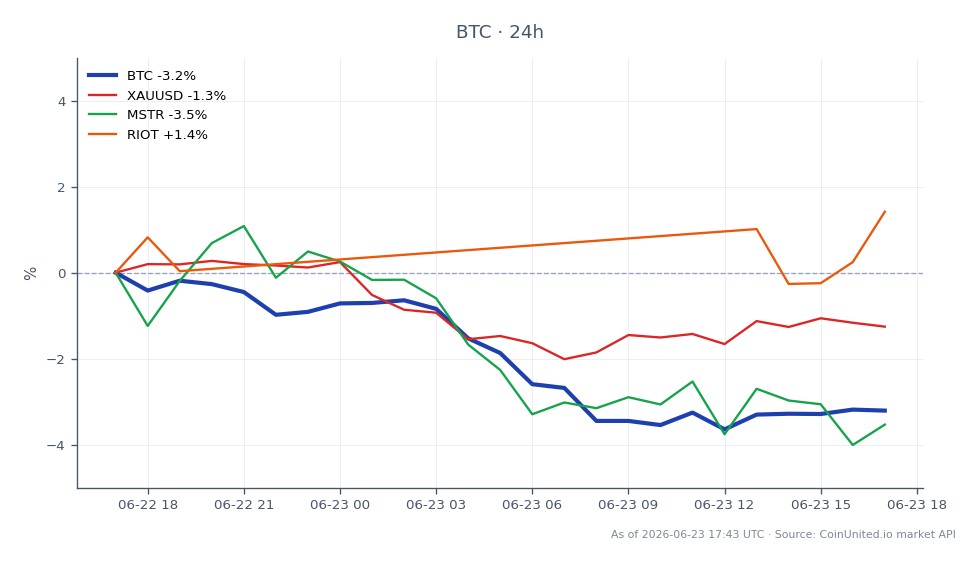
Bitcoin is trading at $62,529 (24h range: $61,876–$64,328, down 3.35%) in an ongoing multi-week corrective phase, with the $60,000 level emerging as the dominant technical and psychological battlegrou
Event Summary
Bitcoin is trading at $62,529 (24h range: $61,876–$64,328, down 3.35%) in an ongoing multi-week corrective phase, with the $60,000 level emerging as the dominant technical and psychological battleground. As reported by Bitcoin Magazine and corroborated by FXStreet analysis, BTC initially violated the $65,000 support band — dropping roughly 5% in two hours — before sliding into the low-$60,000s. Analysts now flag $60,000 as coinciding with the 200-week moving average, a long-term anchor that has historically marked cycle lows. A decisive breakdown targets $57,000, a price last seen in September 2024, according to FXStreet. ETF outflows and an upcoming US CPI print are identified as the key near-term catalysts.
Leverage Impact Analysis
The $60,000–$62,529 range creates asymmetric risk for leveraged Bitcoin perpetual positions. With BTC at $62,529, consider these concrete scenarios:
Long squeeze risk: A trader with a 50x long BTC perpetual opened at $62,529 faces liquidation roughly ~2% lower — near $61,291 (assuming standard 2% margin). Given the 24h low of $61,876, this level has already been probed. At 100x leverage, the liquidation threshold sits approximately at $61,904 — essentially within the current intraday range.
Short profit window: A 20x short opened at $62,529 targeting $60,000 yields approximately ~4% move = 80% return on margin — but a bounce from $60,000 (the 200-week MA) back toward $64,000+ would liquidate at roughly $65,641, only ~$1,300 above the 24h high.
Understanding crypto funding rates and positioning squeeze dynamics is critical here: analysts describe derivatives as in "defensive equilibrium" with less crowded longs, reducing cascade liquidation risk — but not eliminating it if $60,000 breaks on CPI surprise. Monitor open interest for confirmation before sizing up. CoinUnited.io's up to 2000x crypto leverage means even small adverse moves near $60K carry outsized liquidation exposure — position sizing is paramount.
Cross-Market Impact
Crypto-proxy equities: MicroStrategy (MSTR) and Coinbase (COIN), Riot Platforms all carry high BTC beta. A decisive $60K breakdown would pressure MSTR's NAV premium, which is already a leveraged proxy — as detailed in our MSTR Bitcoin leverage model guide. Miners like MARA and RIOT face direct revenue compression below $60K.
DXY & Gold: BTC's test of $60K is tied to broader risk-off conditions and an upcoming US CPI print — a macro nexus covered in depth in our CPI inflation trading guide. A hot CPI print strengthens the U.S. Dollar Currency Index, pressuring BTC and risk assets simultaneously. Gold benefits from the inflation-hedge asset rotation dynamic — a BTC breakdown + USD strength scenario historically sees gold outperform as a defensive alternative.
NASDAQ/Risk assets: BTC's high-beta nature means the $60K hold/fail is a sentiment barometer for growth equities. Concurrent CPI miss + BTC breakdown would reinforce macro inflation pressure risk-off flows broadly.
Trading Considerations
Key levels: Support at $60,000 (200-week MA, psychological), next support $57,000. Resistance at $64,327 (24h high), then mid-$65,000s (prior support-turned-resistance). A reclaim of $65K+ is needed to structurally negate downside risk.
What to watch: The US CPI release is the binary trigger — a soft print could catalyze a bounce from current levels, while a hot print risks accelerating the break toward $57K. ETF flow data (daily net flows) serves as a real-time institutional sentiment gauge. Watch open interest divergence signals for signs of leveraged capitulation or fresh short-side buildup at current levels.
Trade Bitcoin on CoinUnited.io
Trade BTC with up to 2000xx leverage → | Create Free Account
Frequently Asked Questions
A 50x long opened at $62,529 liquidates near $61,291 (~2% lower); a 100x long liquidates near $61,904 — both within the current 24h low of $61,876, meaning these levels have already been tested. Reduce size or use wider stops near a major support like $60K.
Continue Exploring
Disclaimer: This brief is for educational purposes only and is not investment advice.