Quick Links
Eurozone Inflation Hits 3.2% on Iran-Linked Energy Spike: Leverage Map for EUR/USD, WTI at $75.47, and Cross-Market Stagflation Repricing
Data Snapshot
Key Takeaways
- •Eurozone headline inflation hit 3.2% YoY in May 2026 (vs. 3.0% prior), per Eurostat flash estimates — above the ECB's 2% target and driven primarily by energy costs.
- •Leveraged EUR/USD positions face bi-directional risk: hawkish ECB delay is EUR-bullish, but stagflation growth drag is EUR-bearish — both can trigger rapid stop-outs at high leverage.
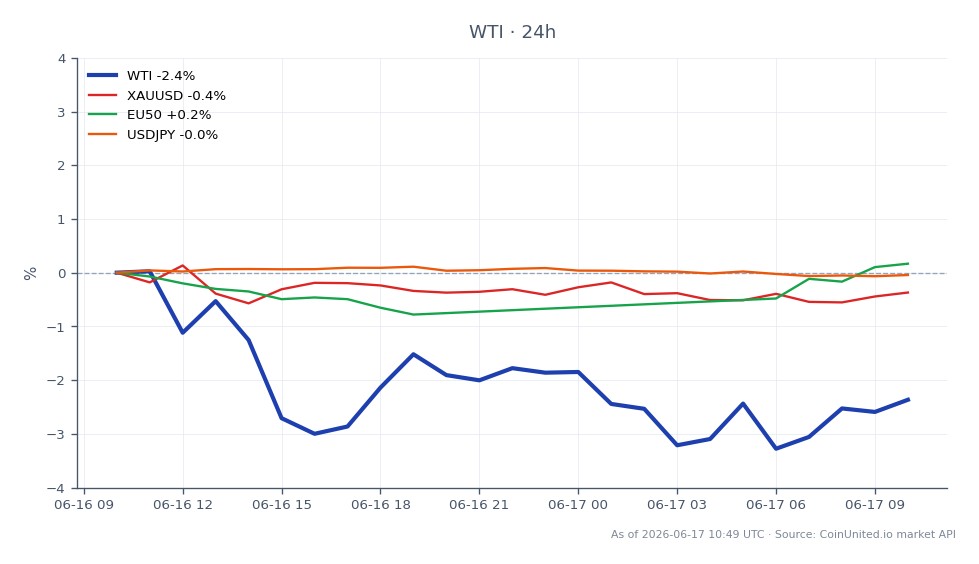
- •WTI at $75.47 has a $1.98 intraday range — sufficient to liquidate positions above 30x leverage without stop discipline; any Iran escalation reopens the path toward $76+ resistance.
- •Cross-market: Gold benefits from stagflation hedging; USD/JPY and USD/CHF gain on safe-haven demand; Euro Stoxx 50 and CAC 40 face valuation compression from higher discount rates.
- •The key question for persistence: whether this energy spike remains geopolitically driven (transitory) or reflects structural Middle East supply disruption — monitor Brent term structure and TTF natural gas for confirmation.
According to Eurostat flash estimates, euro area annual inflation is expected at 3.2% in May 2026, up from 3.0% in April 2026 — accelerating further above the European Central Bank's 2% target. Energy
Event Summary
According to Eurostat flash estimates, euro area annual inflation is expected at 3.2% in May 2026, up from 3.0% in April 2026 — accelerating further above the European Central Bank's 2% target. Energy prices remain a primary driver of the headline move, with Iran-linked geopolitical risk in the Middle East cited as a plausible macro attribution for the energy component's upward pressure. The print appears broadly in line with forecasts but confirms a persistent upward drift that markets cannot dismiss as transitory. This is a direct challenge to any remaining ECB rate-cut narrative, compounding the macro inflation pressure that has been building since early 2026.
Live market data shows WTI Light Crude Oil trading at $75.47, having reached a 24h high of $76.07 before retreating — a -0.39% session move that reflects some near-term geopolitical risk premium already priced in. Whether this energy spike is a short-lived risk event or a structural supply concern is the defining question for how far macro inflation risk-off repricing extends across asset classes.
Leverage Impact Analysis
For leveraged forex traders, the EUR/USD response hinges on whether markets price this as an ECB hawkish delay (EUR-supportive) or a stagflation signal (EUR-negative). Both scenarios carry violent leverage risk.
Scenario A — ECB hawkish hold: A trader long EUR/USD at 100x with entry at 1.0900 sees approximately $1 pip value amplified 100x. A 50-pip EUR/USD rally to 1.0950 on delayed-cut repricing generates ~$500 per standard lot — but a 50-pip reversal on growth fears liquidates the same position if margin is thin.
Scenario B — Stagflation drag: Short EUR/USD at 200x faces acute stop-out risk around key support. With WTI at $75.47 and not yet spiking aggressively, the energy impulse remains moderate — but any escalation toward the recent $91+ levels seen in prior pulses could rapidly reprice Eurozone growth expectations downward.
For WTI CFD positions: a 50x long WTI opened at $75.47 requires only a $0.75 adverse move (-1%) to consume 50% of margin. With the 24h range already spanning $74.09–$76.07 ($1.98), intraday volatility is sufficient to trigger stop-outs on positions sized above 30x without disciplined risk management. Monitor the oil geopolitical risk-off theme for escalation signals that could retest the $76 resistance.
Cross-Market Impact
Eurozone Equities: The Euro Stoxx 50 and CAC 40 face dual pressure: higher discount rates compress valuations while energy-intensive sectors (autos, chemicals, airlines) absorb cost-push headwinds. Energy producers are the relative beneficiary — sector rotation, not index-wide selling, is the more nuanced trade per the 2026 Global Indices Outlook.
Gold & DXY: If ECB cuts are delayed while Fed remains data-dependent, the U.S. Dollar Currency Index gains a relative policy advantage. Gold benefits via the stagflation channel — negative real rates and geopolitical hedging demand. The gold vs. USD inverse relationship becomes the key macro hedge to watch alongside XAU/USD.
JPY & CHF: Safe-haven flows into USD/JPY and USD/CHF intensify if Eurozone stagflation fears escalate. EUR/JPY and EUR/CHF shorts become thematic trades as detailed in the stagflation trading guide.
Crypto: BTC faces a narrative split — inflation hedge demand vs. risk-off selling if real yields rise. High-beta altcoins remain most vulnerable to equity-correlated deleveraging. Check the 2026 Crypto Market Outlook for macro sensitivity context.
Trading Considerations
For WTI, the immediate zone to watch is $74.09 (24h low) as near-term support and $76.07 (24h high) as resistance. A sustained break above $76 with fresh Iran escalation news could reassert the energy-inflation feedback loop. For EUR/USD, the key pivot is whether the ECB signals any policy shift at its next meeting — until then, range-bound chop around current levels is the base case.
The core risk: if energy-driven inflation proves persistent rather than transitory, the stagflation premium reprices all Eurozone assets simultaneously — bonds sell off, equities compress on growth fears, and EUR weakens despite higher inflation. Position sizing below 50x on EUR and energy crosses is warranted until the ECB reaction function clarifies.
Trade WTI Light Crude Oil on CoinUnited.io
Trade WTI with up to 1000xx leverage → | Create Free Account
Frequently Asked Questions
At 100x leverage, a 50-pip EUR/USD move represents significant P&L swings — the print delays ECB cuts (EUR-supportive) but stagflation fears can reverse that quickly. Traders should monitor the ECB's next meeting for policy guidance before sizing up.
Continue Exploring
Disclaimer: This brief is for educational purposes only and is not investment advice.