Quick Links
HPE Surges 25%+ on 40% Revenue Beat — AI Server Demand Confirms Sector-Wide Re-Rating
Data Snapshot
Key Takeaways
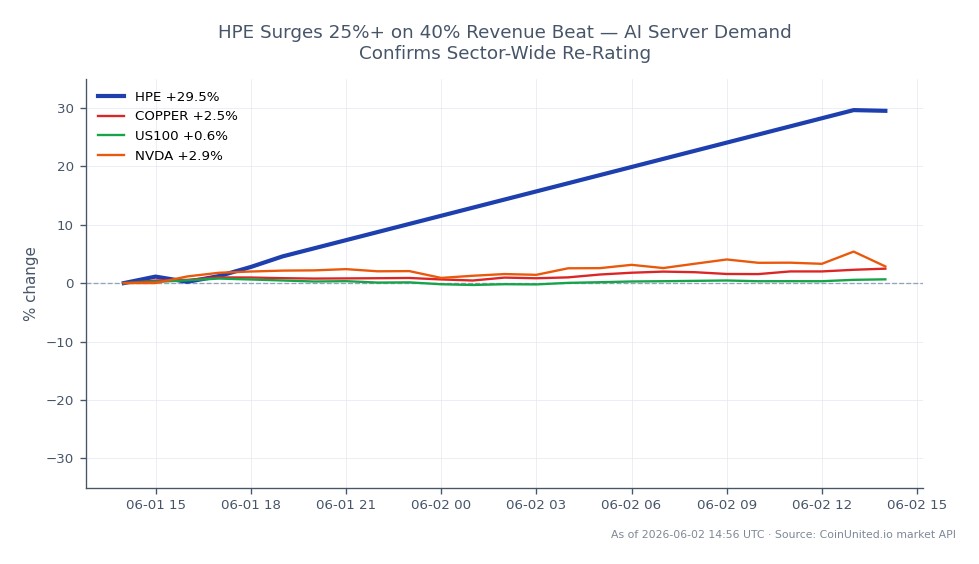
- •HPE reported ~$10.678B in Q2 2026 revenue (+40% YoY), driving a +24.39% session gain to $58.95 — its best single-day performance on record.
- •Leveraged short HPE CFD holders above 5x opened below $55 face near-certain liquidation; the move underscores gap risk for traders limited to NYSE session hours.
- •The 40% revenue beat confirms AI server demand is sector-wide, not HPE-specific — positive read-through to Dell, NVIDIA, and the NASDAQ 100.
- •Post-earnings drift is the base case if $57.92 session support holds; a gap-fill toward $52–$53 is the key downside scenario to monitor.
- •Copper and AI power infrastructure names benefit structurally from sustained data-center capex, though HPE's single print is insufficient to move commodity prices near-term.
Hewlett Packard Enterprise (NYSE: HPE) reported fiscal Q2 2026 results (quarter ended April 30, 2026) that dramatically exceeded expectations. According to TradingKey and HPE's investor relations site
Event Summary
Hewlett Packard Enterprise (NYSE: HPE) reported fiscal Q2 2026 results (quarter ended April 30, 2026) that dramatically exceeded expectations. According to TradingKey and HPE's investor relations site, revenue came in at approximately $10.678 billion, up ~40% year-over-year, driven by robust server and AI-infrastructure demand. HPE also swung to profit versus prior periods, indicating meaningful margin expansion alongside the top-line surge.
As reported by multiple sources, HPE shares surged as high as +38% in after-hours trading (~$64.43), with the live session now showing HPE at $58.95, up +24.39% on the day (24h high: $64.24; 24h low: $57.92). This is tracking as the stock's best single-day performance in its listed history — a rare outcome for a large-cap enterprise IT hardware name.
Leverage Impact Analysis
For CFD traders on CoinUnited.io, HPE's +24.39% intraday move creates both outsized gains and severe liquidation risk depending on position direction and sizing.
Long scenario: A trader opening a 50x long HPE CFD at the session open near $47.40 (pre-gap implied entry) would see position value multiplied ~12x on a 24% move — a $1,000 margin position controlling $50,000 notional would reflect ~$12,195 in gains before fees. At current price $58.95, that position remains well in profit.
Short squeeze risk: Any short HPE CFD held into earnings faces extreme margin pressure. A 20x short opened at $50.00 would face a ~487% adverse move relative to margin — well past automatic liquidation thresholds. Short positions with leverage above 5x opened below $55 are likely already stopped out.
Gap risk context: The bulk of HPE's move occurred in after-hours trading — a structural gap risk for traders on platforms limited to NYSE session hours. CoinUnited's 24/7 stock CFD trading allowed positioning as the after-hours print developed, rather than waking up to a gapped open.
Given the magnitude of the move, volatility remains elevated. Position sizing should reflect the possibility of a post-earnings vol crush and mean-reversion — large single-day earnings gaps frequently retrace 30–50% of the move within 5 sessions.
Cross-Market Impact
HPE's 40% revenue growth is not idiosyncratic — it validates a tech & energy multi-sector earnings beat cycle already signaled by Dell Technologies' prior blowout quarter. For cross-market traders:
- -Dell Technologies (DELL): Directly corroborated as an AI-server peer. HPE's print reduces any lingering doubt that Dell's results were one-off. DELL CFDs may see sympathetic strength.
- -NVIDIA (NVDA): HPE's server demand is downstream GPU and accelerator demand. This is another data point supporting the AI monetization and chip demand thesis. NVDA's near-term dip risk reduces on this confirmation.
- -NASDAQ 100: HPE's index weighting contributes positive sector attribution. The US100 index CFD benefits from broad AI-infrastructure earnings confirmation.
- -Copper: Data center buildout is structurally copper-intensive (power infrastructure, cabling). A single quarter won't move copper spot, but sustained AI capex acceleration is a medium-term demand tailwind per the AI datacenter energy cycle.
- -IBM: Enterprise IT spending strength is a mild positive read-through for IBM's hybrid cloud and infrastructure segments.
Trading Considerations
Key levels for HPE CFDs: the 24h high of $64.24 represents the after-hours peak and first resistance. Current session price of $58.95 is the immediate reference. A hold above $57.92 (24h low/session support) suggests the move is being defended. A break below $57 would signal early profit-taking and potential gap-fill toward $52–$53.
Monitor open interest and funding rates on HPE CFDs for confirmation of sustained long conviction versus crowded positioning. The Q1 earnings beat and outlook upgrade dynamic — where raised guidance anchors post-earnings drift — is the base case here, but requires the $57.92 support to hold.
Trade Hewlett Packard Enterprise Company on CoinUnited.io
Trade HPE with up to 1000xx leverage → | Create Free Account
Frequently Asked Questions
After a move of this magnitude, intraday volatility typically remains elevated — lower leverage (10x–25x) with defined stop-losses near $57.92 is more appropriate than max leverage. Oversized positions risk being stopped out by normal post-earnings intraday swings.
Continue Exploring
Disclaimer: This brief is for educational purposes only and is not investment advice.