Quick Links
'The Rally That Wasn't': Bitcoin's 14% Slide Unpacked — ETF Exodus, Strategy's First BTC Sale Since 2022, and Leverage Liquidation Risk
Data Snapshot
Key Takeaways
- •US spot Bitcoin ETFs recorded 12 consecutive days of net outflows totaling $3.58 billion, removing the institutional bid that previously cushioned price declines.
- •Strategy sold 32 BTC at $77,135 average between May 26–31 — its first BTC sale since December 2022 — breaking the 'never sell' narrative and creating a symbolic bearish signal.
- •Leveraged long BTC positions opened at $80,000+ with 50x leverage are deeply underwater; a further 5% drop to ~$69,600 represents the next key technical risk level.
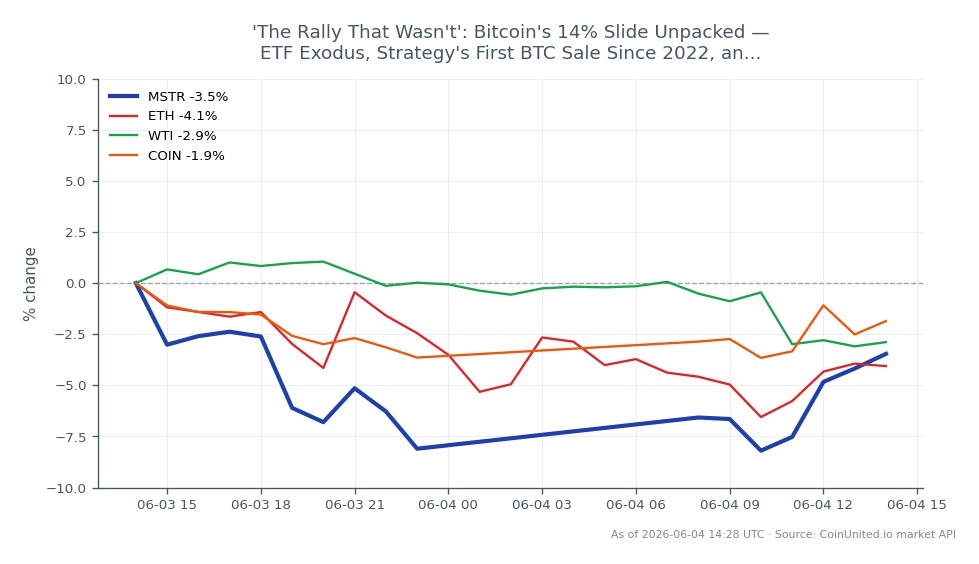
- •Ethereum fell to $1,970 and MSTR (currently $130.10) remains structurally exposed to BTC downside via NAV compression — cross-market contagion is confirmed.
- •US-Iran tensions and fading Fed easing expectations form a macro feedback loop through oil volatility into crypto and growth equities — monitor WTI and Fed signals as leading indicators.
Bitcoin suffered a sharp multi-week deterioration, with prices trading as low as $73,294 according to CryptoNews, and breaking below $70,000 per IG Markets. The selloff was driven by a convergence of
Event Summary
Bitcoin suffered a sharp multi-week deterioration, with prices trading as low as $73,294 according to CryptoNews, and breaking below $70,000 per IG Markets. The selloff was driven by a convergence of institutional outflows, a symbolic corporate selling signal, and macro risk-off pressure. As reported by IG Markets, US-listed spot Bitcoin ETFs logged 12 consecutive days of net outflows totaling $3.58 billion since May 15, while a separate report cited approximately $1.5 billion withdrawn in May alone.
The most symbolically significant catalyst: Strategy sold 32 BTC between May 26–31 at an average price of $77,135 — its first Bitcoin sale since December 2022. This cracked the firm's closely watched "never sell" narrative. Compounding the pressure, escalating US-Iran tensions and fading Fed rate-cut expectations drove broad risk-off positioning across crypto, equities, and oil markets — a pattern consistent with the oil shock and geopolitical risk-off repricing playbook.
Leverage Impact Analysis
This selloff has been particularly punishing for leveraged long holders. Consider a trader who opened a 50x BTC perpetual long at $82,000 on CoinUnited.io: with BTC at $73,294, that position is down ~10.6% on the underlying — equivalent to 530% loss on margin, triggering forced liquidation well before the current price floor.
The 12-day ETF outflow streak signals sustained institutional redemption pressure, not a single-day flush. This environment suppresses the bid that typically absorbs liquidation cascades, meaning recovery bounces are shallower and shorts can extend further. Traders holding 20x–100x long BTC perpetuals should note that a further 5% decline to ~$69,600 would represent another significant technical breakdown. The crypto treasury liquidation dynamic adds reflexivity: if Strategy continues selling, BTC price weakness could force further MSTR equity dilution, creating a feedback loop.
Funding rates on perpetuals should be monitored closely — persistent negative funding would signal entrenched bearish positioning and potential short-squeeze setups, while positive funding in a downtrend indicates overleveraged longs still at risk.
Cross-Market Impact
Ethereum has not been spared, dropping to $1,970 per unn.ua, with ETH ETFs also reporting outflows. Solana and other high-beta altcoins face amplified drawdowns due to their higher correlation to BTC in risk-off periods.
Strategy (MSTR) is trading at $130.10 (up 5.05% on the day per live data), but this intraday bounce follows significant recent weakness — the stock's equity premium over NAV is structurally compressed whenever BTC trends lower. Coinbase (COIN) faces dual pressure from lower crypto prices (reduced trading volumes and revenue) and institutional sentiment deterioration. WTI crude volatility matters here because geopolitical escalation feeds inflation expectations, delaying Fed easing and removing a key macro tailwind for risk assets. The macro inflation risk-off repricing theme is actively in play across NASDAQ and high-beta equity sectors, with crypto acting as a leading stress indicator rather than a diversifier.
Trading Considerations
Key levels to watch: $70,000 (recent breakdown zone, now resistance), $73,294 (recent low), and $77,135 (Strategy's average sale price — a near-term supply overhang). A decisive close back above $77,000 would be required to signal deterioration has paused. The strategy BTC treasury sell pressure theme remains active as long as MSTR's MNAV ratio creates dividend funding incentives to sell.
The 12-day consecutive outflow streak is the primary flow signal to watch — a reversal to net inflows in spot BTC ETFs would be the clearest leading indicator of institutional demand returning.
Trade MicroStrategy Inc on CoinUnited.io
Trade MSTR with up to 500xx leverage → | Create Free Account
Frequently Asked Questions
Positions opened at $80,000–$85,000 with 20x–50x leverage are already in or near liquidation territory at current prices below $74,000. A further drop to $69,600–$70,000 represents the next critical zone where cascading liquidations could accelerate the selloff.
Continue Exploring
Disclaimer: This brief is for educational purposes only and is not investment advice.