Quick Links
Strategy's 32 BTC Sale Is Small — But the Forced-Sell Feedback Loop Could Hit Leveraged BTC & MSTR Positions Hard
Data Snapshot
Key Takeaways
- •Strategy sold 32 BTC to fund preferred dividends — small in absolute terms but a structural precedent that breaks the 'never sell' thesis underpinning MSTR's mNAV premium.
- •Leverage risk: A 50x long MSTR CFD entered at $150 has consumed ~130% of initial margin at current $146.08 prices; a move to $143–$144 triggers liquidation without margin top-up.
- •The reflexive loop is the real danger: BTC price decline → mNAV compression → equity issuance harder → more BTC sales forced → further BTC decline.
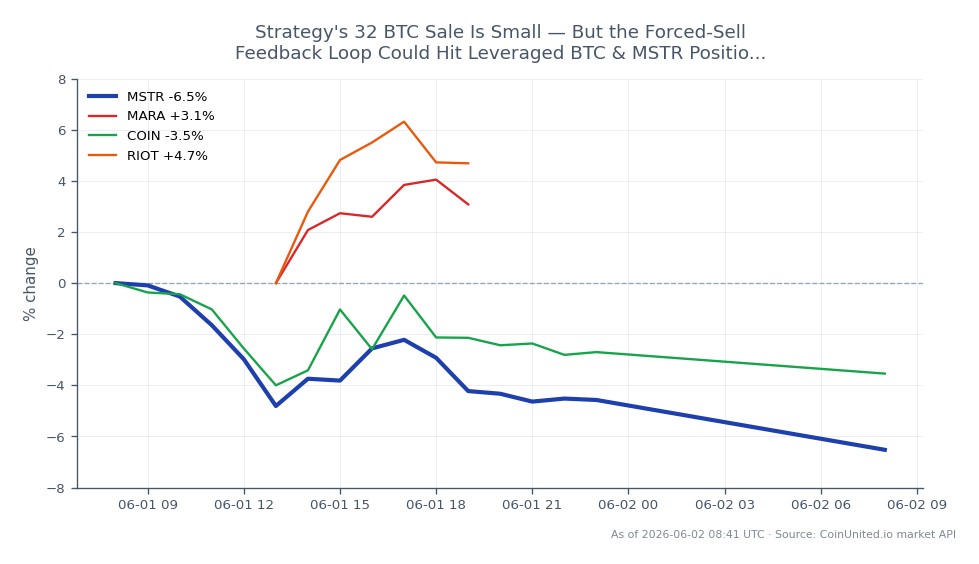
- •Cross-market: MARA and RIOT face secondary BTC price contagion; COIN faces volume-driven revenue risk; Gold may benefit as the 'clean' inflation hedge if crypto-treasury narrative weakens.
- •Watch funding rates and open interest on BTC perpetuals — if longs remain elevated despite this bearish signal, the correction potential is amplified.
Strategy (formerly MicroStrategy) has sold 32 Bitcoin — a modest disposal by the company's own 568,840+ BTC treasury scale — to meet preferred stock dividend obligations. While 32 BTC represents a rou
Event Summary
Strategy (formerly MicroStrategy) has sold 32 Bitcoin — a modest disposal by the company's own 568,840+ BTC treasury scale — to meet preferred stock dividend obligations. While 32 BTC represents a rounding error against its total holdings, the significance lies in the precedent: for the first time in years, dividend pressure has triggered an actual BTC liquidation event. The Strategy BTC Treasury Sell Pressure theme is no longer hypothetical. MSTR stock is currently trading at $146.08, down 2.09% on the day (24h range: $145.91–$147.23), reflecting the market's repricing of the 'never sell' premium that historically underpinned MSTR's mNAV valuation.
The critical question analysts are now asking is not whether 32 BTC matters — it doesn't, in isolation — but whether this signals a repeatable mechanism. If BTC prices decline, Strategy's mNAV compresses, its equity funding window narrows, and dividend obligations remain fixed. That creates a conditional sell engine, as covered in prior CoinUnited analysis of Strategy's MSTR Bitcoin Premium and NAV gap dynamics.
Leverage Impact Analysis
For leveraged traders, the asymmetric risk here runs in both directions:
Long MSTR CFD scenario: A trader holding a 50x long MSTR CFD entered at $150.00 is already sitting on a ~2.6% adverse move at current $146.08 prices. At 50x, that translates to approximately 130% of initial margin consumed. Any further BTC-driven MSTR decline toward $143–$144 would trigger liquidation for positions opened near $150 without additional margin buffer.
BTC perpetual long scenario: A 20x long BTC perpetual opened near any recent high faces compounding liquidation pressure if Strategy's selling — however small today — signals a pipeline of future sales. Watch funding rates on CoinUnited.io; elevated long-side funding would indicate the market is still positioned optimistically despite this bearish signal.
The crypto treasury liquidation dynamic is the key risk to monitor: if BTC drops meaningfully, Strategy's mNAV falls below 1x, preferred dividends become harder to fund via equity issuance, and BTC sales could accelerate — a reflexive loop that disproportionately impacts leveraged longs.
Cross-Market Impact
The inflation hedge asset rotation thesis complicates the picture. If investors interpret Strategy's sale as a signal that BTC-as-treasury is structurally strained, capital may rotate toward traditional inflation hedges (Gold, TIPS) rather than crypto proxies.
- -MSTR: Direct impact; mNAV premium erosion is the primary risk. Monitor whether MSTR trades at a discount to BTC NAV — historically a precursor to sharper drawdowns.
- -MARA & RIOT: Secondary contagion via BTC price correlation. These miners have no dividend-driven sell pressure but suffer if BTC spot weakens.
- -COIN: Revenue is exchange-volume dependent; a broader BTC risk-off sentiment would reduce retail activity and hit COIN earnings expectations.
- -Gold / Commodities: A BTC narrative crack could modestly benefit gold as the 'clean' inflation hedge — watch for divergence in XAU/BTC ratio.
Trading Considerations
Key levels for MSTR CFD traders: $145.91 (today's 24h low) is immediate support; a break below $144 opens the door toward the $135–$138 range where the mNAV discount deepens materially. Resistance sits at $147.23 (24h high). For BTC perpetuals, the immediate question is whether this sell event gets absorbed without a meaningful spot price reaction — if BTC holds, MSTR may stabilize; if BTC weakens concurrently, the reflexive loop accelerates.
Monitor open interest and funding rates on CoinUnited.io for directional confirmation before adding leveraged exposure in either direction.
Trade MicroStrategy Inc on CoinUnited.io
Trade MSTR with up to 500xx leverage → | Create Free Account
Frequently Asked Questions
At $146.08 with a 24h low of $145.91, traders who opened 50x longs near $150 have absorbed roughly 2.6% adverse movement — equivalent to ~130% of initial margin at 50x. A decline to $143–$144 would liquidate undefended positions opened at $150.
Continue Exploring
Disclaimer: This brief is for educational purposes only and is not investment advice.