Быстрые ссылки
Gold's Worst Quarter in 13 Years: How the $4,000 Break and Fed Hike Bets Are Squeezing Leveraged XAUUSD Traders
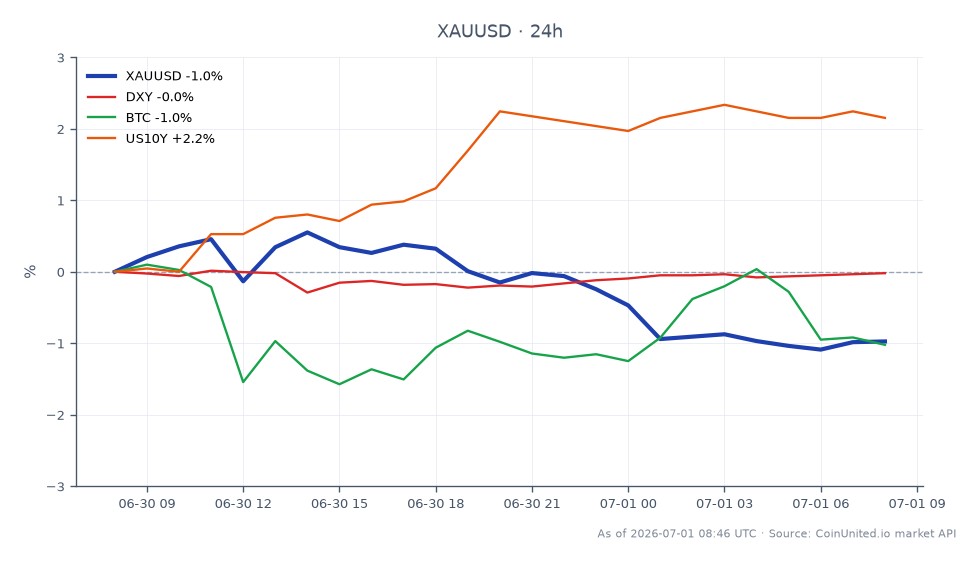
Снимок данных
Основные выводы
- •Gold is on track for a ~13% quarterly decline — worst since 2013 — with spot XAUUSD currently at $3,976.83 and $4,000 now acting as resistance.
- •Leverage alert: 50x long Gold CFD positions entered above $4,010 are near liquidation thresholds; the $58 daily range demands careful margin management even at 10x–20x leverage.
- •DXY at a 13-month high and EURUSD at its lowest since June 2025 confirm the USD strength transmission channel crushing non-yielding assets.
- •Cross-market divergence is stark: S&P 500 is having its best quarter since 2020 while gold has its worst — risk-on rotation is the dominant regime.
- •Central bank buying (45% planning to increase holdings) provides a longer-term demand floor, but near-term macro flows favor further downside toward $3,850–$3,900.
As reported by Kitco and confirmed across multiple market sources, gold is on track for its worst quarterly performance since 2013 — a roughly 13% decline — driven by aggressive Federal Reserve rate-h
Event Summary
As reported by Kitco and confirmed across multiple market sources, gold is on track for its worst quarterly performance since 2013 — a roughly 13% decline — driven by aggressive Federal Reserve rate-hike expectations and a surging U.S. dollar. Spot XAUUSD is currently trading at $3,976.83, with a 24h range of $3,960.22–$4,018.43, sitting just below the critical $4,000 psychological level after breaking it decisively this quarter. According to roic.ai, the DXY has climbed to a 13-month high, with EURUSD falling to its lowest level since June 2025. Gold ETF outflows and hedge fund net-long reductions on Comex signal broad speculative capitulation, per World Gold Council data.
The macro backdrop aligns with the Fed Macro Policy Crossroads theme: rising real yields erode the carry case for non-yielding bullion while cash and Treasuries absorb rotational flows. Notably, market commentary contrasts gold's worst quarter with the S&P 500 posting its best quarter since 2020 — a sharp risk-on divergence.
Leverage Impact Analysis
The $4,000 break is the defining leverage event of this quarter for gold CFD traders. That level has now flipped from support to resistance, resetting liquidation thresholds and systematic stop-loss clusters for long positions opened above it.
Long squeeze scenario: A trader holding a 50x long Gold CFD entered at $4,050 now carries an unrealized loss of ~$73/oz. With 50x leverage, that represents a ~90% drawdown on margin — liquidation risk is acute for any position entered above $4,010 at this leverage tier without added margin.
Short opportunity scenario: A 20x short Gold CFD entered at $4,020 with current price at $3,976.83 captures ~$43/oz move — roughly 215% return on margin. Bears watching the $3,850–$3,900 support band as the next key target if selling pressure persists.
Position sizing note: With the 24h range already spanning $58 ($3,960–$4,018), even moderate leverage (10x–20x) sees full daily-range moves consuming 5–10%+ of margin. Traders should monitor funding rates and open interest on CoinUnited.io for crowding signals before sizing new shorts into the $3,850 target.
For context on how the gold-dollar inverse relationship drives these moves, the mechanics are well-established: every leg higher in DXY compresses the gold bid and weakens the inflation-hedge thesis.
Cross-Market Impact
This is a full Fed & ECB Policy Divergence Repricing event with multi-asset reach. The DXY at a 13-month high is the transmission mechanism: USD strength simultaneously pressures gold, EURUSD, and Bitcoin via tighter global USD liquidity. The United States 10 Year Yield rising in tandem amplifies the real-yield headwind on non-yielding assets.
Equities have decoupled sharply — the S&P 500's best quarter since 2020 reflects a risk-on rotation *away* from defensive assets like gold into growth. Gold miners (GDX-type baskets) face margin compression at sub-$4,000 spot, making them underperformers even in a broadly constructive equity tape. The inflation-hedge asset rotation playbook is being unwound in real time: falling energy costs have eroded the inflation-narrative support that drove gold's earlier 2025 rally.
For Bitcoin, the picture is mixed — risk-on equities provide a tailwind, but a strong USD and rising real yields historically tighten the liquidity conditions that support long-duration crypto assets.
Trading Considerations
$4,000 is now confirmed resistance after the quarterly break. The immediate support zone is $3,960–$3,976 (current range lows), with the deeper structural target at $3,850–$3,900 if sellers maintain control into quarter-end. A reclaim of $4,020+ on a daily close would be the first signal of short-term reversal for tactically long traders.
Key risk factors to watch: any Fed communications softening the rate-hike path, a DXY pullback from its 13-month high, or central bank physical buying acceleration (45% of central banks plan to increase gold holdings, per cruxinvestor.com) — all could trigger sharp short-covering squeezes given how stretched speculative positioning has become.
Trade Gold / US Dollar on CoinUnited.io
Trade XAUUSD with up to 2000xx leverage → | Create Free Account
Часто задаваемые вопросы
With 50x leverage, a 2% adverse move wipes the margin — meaning a position entered at $4,000 faces liquidation near $3,920, well within the current trading range of $3,960–$4,018. Adding buffer margin or reducing to 20x leverage moves that threshold to approximately $3,800.
Продолжить исследование
Отказ от ответственности: Этот бриф предназначен только для образовательных целей и не является инвестиционной рекомендацией.