Быстрые ссылки
Gold Near 7-Month Low at $4,028 as Fed Hike Bets Supercharge Dollar — Leveraged XAUUSD Shorts in Focus
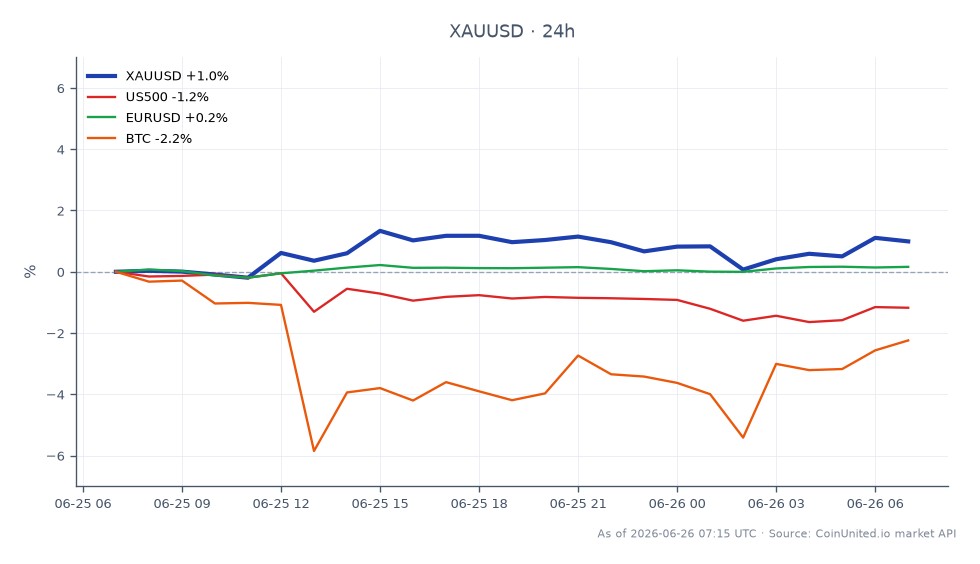
Снимок данных
Основные выводы
- •Spot gold trades at $4,028.14 (24h low: $3,983.17), a seven-month low driven by ~67% CME-priced odds of a September Fed hike and a dollar at 13-month highs.
- •Leveraged XAUUSD longs entered above $4,100 face ~90% margin drawdown at 50x — position sizing and stop placement around $4,036 (24h high) are critical.
- •Silver (-4%), platinum and palladium (>-4% each) confirm broad precious metals complex weakness, not just gold-specific selling.
- •Cross-market: Rising USD and yields pressure EUR/USD, may extend USD/JPY carry, and indirectly tighten conditions for Bitcoin and long-duration risk assets.
- •ING revised Q3 2026 gold forecast to ~$4,300/oz — upcoming PCE data is the next major trigger for either accelerating the breakdown toward $3,900 or staging a relief rally.
As reported by Reuters and CNBC, spot gold has slumped to a seven-month low, briefly breaching the psychologically critical $4,000/oz level before stabilizing. Live market data shows XAUUSD currently
Event Summary
As reported by Reuters and CNBC, spot gold has slumped to a seven-month low, briefly breaching the psychologically critical $4,000/oz level before stabilizing. Live market data shows XAUUSD currently at $4,028.14, with a 24-hour range of $3,983.17–$4,036.64. The move reflects a sharp Fed & ECB rate patience macro repricing as CME FedWatch data shows roughly 66–67% odds of a September Fed hike, with markets pricing up to three hikes in 2026.
According to Reuters, the dollar index has surged to a 13-month high, directly pressuring dollar-priced metals. Silver has fallen ~4% to below $60/oz (lowest since December 2025), while platinum and palladium have each declined more than 4%. ING has revised Q3 2026 gold forecasts down to approximately $4,300/oz, with Q4 around $4,600/oz.
Leverage Impact Analysis
The gold vs. US dollar inverse relationship is the core driver here, and leverage amplifies every tick in a volatile repricing environment.
Long squeeze scenario: A trader holding a 50x long Gold CFD entered at $4,100 is now sitting on a ~1.8% adverse move ($4,100 → $4,028), translating to roughly 90% drawdown on margin at 50x. A move to the next key support at $3,900 would represent a ~5% drop from $4,100 — sufficient to liquidate positions with less than 5% margin buffer at 20x leverage or higher.
Short opportunity framing: Traders expressing the Fed macro policy crossroads thesis via short Gold CFDs face a cleaner risk structure. A 20x short entered at $4,028 with a stop above $4,037 (24h high) risks ~0.22% on spot — just 4.4% on leveraged margin — while targeting $3,900 for a ~3.2% move (+64% leveraged return at 20x).
Volatility note: With gold ranging $53 intraday ($3,983–$4,036), even moderate leverage (10x–20x) can trigger meaningful margin erosion on retracements. Monitor funding rates and open interest on CoinUnited.io for positioning confirmation signals before sizing up.
Cross-Market Impact
The Fed & ECB policy divergence repricing radiates across asset classes:
- -EUR/USD: Dollar at 13-month highs compresses EUR/USD. A 100x long EURUSD position faces sustained headwinds as rate differentials widen in USD's favor.
- -USD/JPY: Higher U.S. yields widen the BoJ-Fed gap, supporting further USD/JPY upside — a carry trade tailwind.
- -US 10-Year Yield: Rising yields raise the opportunity cost of non-yielding gold directly. Watch the 10Y for confirmation of further gold pressure.
- -Bitcoin: Hawkish Fed and tighter real rates historically pressure long-duration risk assets including crypto. ETF outflows from bullion may partially redirect toward equities rather than BTC.
- -S&P 500: Equity rotation out of gold into AI/growth stocks supports index levels near-term, though higher rates eventually cap multiples.
- -Gold miners: High-beta miners underperform spot gold on downmoves — margin compression accelerates as realized prices fall toward ING's revised $4,300 Q3 target.
Trading Considerations
Key levels: $4,000 (psychological/options strike) and $3,900 (analyst-cited structural support) are the critical zones to monitor. A clean daily close below $4,000 could trigger CTA/systematic selling acceleration. Central bank buying is cited by Reuters as a potential floor factor, but has not prevented the current slide.
Upcoming U.S. PCE data is the primary catalyst to watch — a hotter-than-expected print would reinforce the FOMC inflation policy crossroads narrative and likely push gold toward the $3,900 test. A softer PCE could trigger a relief rally toward $4,100 resistance.
Trade Gold / US Dollar on CoinUnited.io
Trade XAUUSD with up to 2000xx leverage → | Create Free Account
Часто задаваемые вопросы
A 50x long Gold CFD entered at $4,100 would face liquidation with less than a ~2% adverse move — approximately at $4,018 with a 2% margin buffer. At $3,983 (today's low), positions entered above $4,050 with 50x leverage would already be deeply in distress.
Продолжить исследование
Отказ от ответственности: Этот бриф предназначен только для образовательных целей и не является инвестиционной рекомендацией.