クイックリンク
Bitcoin Reclaims $61K as Inflation Fears Soften — Leverage Traders Eye $65K or $52K Binary Setup
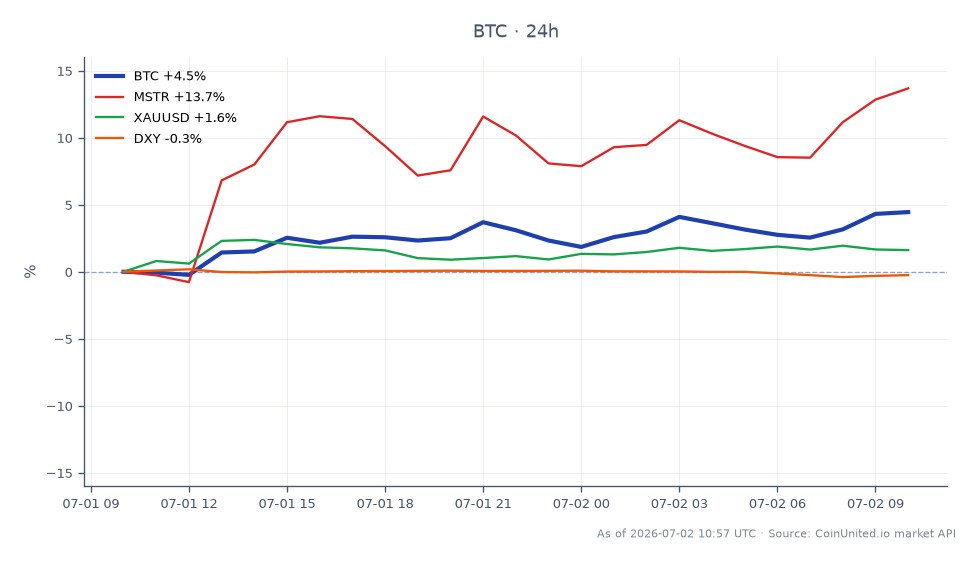
データスナップショット
重要なポイント
- •BTC is trading at $61,239 (+3.93% 24h), recovering from a $58,000 flush, within a critical $60k–$65k thin-liquidity zone identified by QCP.
- •Leverage traders: a 50x long at $61,239 faces liquidation near $59,994 on a modest reversal — tight stops are essential in this volatility band.
- •Softening inflation fears (US jobs: 130k, unemployment 4.3%) reduce Fed rate-hike probability, creating a broad risk-on tailwind for BTC, NASDAQ-100, MSTR, and COIN simultaneously.
- •Structural headwinds persist: BTC is 53% below its $126,198 ATH, spot ETF outflows remain in the billions, and institutional rotation into AI equities has not fully reversed.
- •Key downside trigger: any oil price spike from US-Iran tensions could revive sticky inflation fears and accelerate a BTC break below $60k, targeting $52k.
Bitcoin has climbed back above $61,239 (live price), recovering from a recent flush to approximately $58,000 after briefly touching $61,868 intraday, according to reporting by Yahoo Finance UK and Bin
Event Summary
Bitcoin has climbed back above $61,239 (live price), recovering from a recent flush to approximately $58,000 after briefly touching $61,868 intraday, according to reporting by Yahoo Finance UK and Binance Square. The catalyst is a modest softening in macro inflation pressure narratives: a US jobs report showing 130,000 new jobs and an unemployment rate of 4.3% helped stabilize risk sentiment, reducing the probability that the Fed would pivot toward rate hikes rather than cuts. BTC remains roughly 53% below its all-time high of $126,198 (set October 6, 2025), per Bitcoin Magazine, with spot Bitcoin ETF outflows in the billions continuing to weigh on structural sentiment.
The $60,000–$65,000 band has been identified by QCP's head of client coverage as a critical liquidity zone with thin order depth — meaning price moves through this region can be sharp and outsized.
Leverage Impact Analysis
The $61k reclaim is a short-covering catalyst, but leverage traders must respect how fragile this level is. With CoinUnited's BTC perpetual futures offering up to 2000x leverage, position sizing is critical in a zone this contested.
Worked example — Long scenario: A trader opens a 50x long BTC perpetual at $61,239. A move to the $65,000 resistance target (+6.1%) returns +305% on margin. However, a reversal to $58,000 (-5.3%) wipes the position with a -265% drawdown — exceeding the margin at roughly $59,994 liquidation (assuming ~2% maintenance margin buffer).
Worked example — Short squeeze risk: Short positions entered below $60,000 with 20x+ leverage face immediate pressure above $61,239. A continuation to $63,000 represents a +3.2% adverse move, triggering liquidations for shorts with insufficient margin buffer.
According to FXStreet, "sticky inflation fears" remain a tail risk that could drive BTC back below $60k rapidly — making stops essential. Check crypto funding rates on CoinUnited.io for positioning signals before sizing up. The thin liquidity in this band, noted by QCP, implies amplified funding rate volatility during macro data prints.
Cross-Market Impact
The softening inflation hedge asset rotation dynamic ripples across multiple markets simultaneously.
Crypto proxies: MicroStrategy (MSTR) and Coinbase (COIN) typically rally when BTC holds above $61k, as both carry high BTC beta. See the MSTR NAV gap trading guide for specific entry frameworks.
Tech & indices: Yahoo Finance UK notes Dow, S&P 500, and NASDAQ-100 futures were all modestly positive during BTC's recovery — consistent with a broad risk-on tilt when rate-hike fears recede. Lower inflation expectations reduce discount rates on growth assets, supporting both BTC and high-duration tech.
DXY & Forex: Softer inflation fears typically pressure the US Dollar Index as rate-hike premium unwinds. A weaker DXY is historically supportive for BTC and commodities. Monitor CPI and inflation data trading dynamics for confirmation.
Gold (XAUUSD): Gold and BTC are competing inflation hedge assets. When inflation fears soften — rather than surge — gold's safe-haven premium fades, potentially redirecting flows back toward higher-beta BTC.
AI vs. Crypto rotation: Bitcoin Magazine notes capital has been rotating out of crypto into AI-related equities. A sustained BTC hold above $61k may partially slow or reverse this rotation at the margin.
Trading Considerations
The $60,000–$65,000 band is the key battleground, with QCP explicitly flagging thin liquidity that amplifies moves in either direction. A confirmed close above $61,500 improves short-term structure; failure to hold $60,000 on a retest reopens the path toward the $52,000 support identified via Elliott Wave and Fibonacci analysis (per Yahoo Finance UK).
The primary risk catalyst remains any upside CPI/PPI surprise or renewed US-Iran escalation pushing oil higher — the same geopolitical input that triggered the prior flush from $61,868 to $58,000. Monitor the macro inflation and oil geopolitics interplay closely before adding leverage in this zone.
Trade Bitcoin on CoinUnited.io
Trade BTC with up to 2000xx leverage → | Create Free Account
よくある質問
Given QCP's warning of thin liquidity that amplifies moves, high leverage (50x+) carries significant liquidation risk within a ~$1,500–$2,000 adverse move. Traders should calculate liquidation price before entry and consider reducing size relative to wider stop placement.
探索を続ける
免責事項: このブリーフは教育目的のみであり、投資アドバイスではありません。