Quick Links
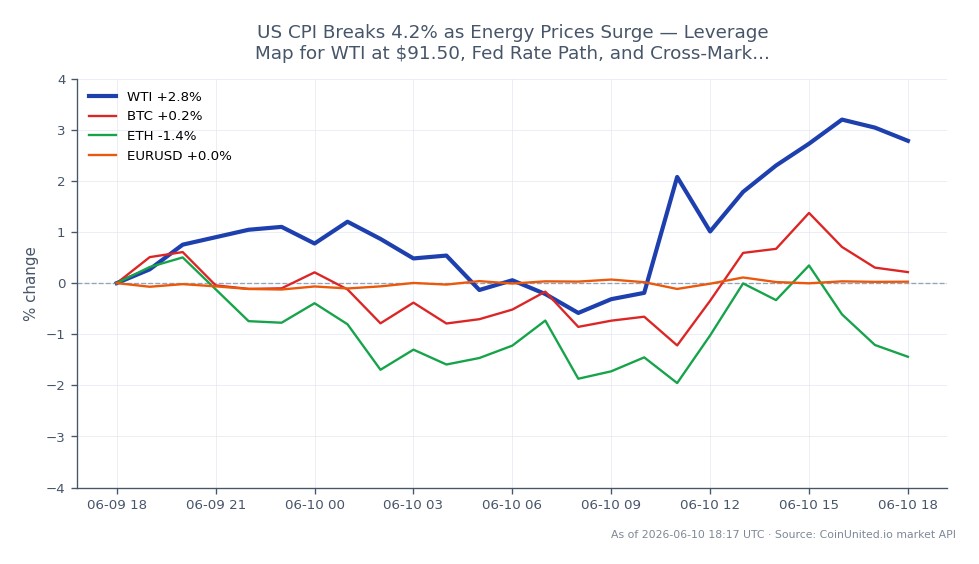
US CPI Breaks 4.2% as Energy Prices Surge — Leverage Map for WTI at $91.50, Fed Rate Path, and Cross-Market Risk-Off
Data Snapshot
Key Takeaways
- •BLS confirmed CPI at 4.2% YoY in May (vs. 3.8% in April), with energy the key accelerator at +3.9% MoM — a direct upside driver for WTI now trading at $91.50.
- •Leverage risk is asymmetric: a 50x WTI long faces liquidation if price retreats to the $88.28 intraday low — less than 4% below current levels.
- •Higher-for-longer Fed repricing is the dominant cross-market transmission: bearish for Nasdaq/growth equities, bullish for USD, mixed for gold.
- •Core CPI at 2.9% YoY confirms inflation is not purely energy-driven — this makes a near-term Fed pivot structurally less likely.
- •Bitcoin and Ethereum face macro headwinds from dollar strength and real yield pressure, though geopolitical risk-off flows remain a wildcard support factor.
According to the U.S. Bureau of Labor Statistics (BLS), the Consumer Price Index rose 0.5% in May and 4.2% year-over-year — up from 3.8% in April — marking a significant re-acceleration in headline in
Event Summary
According to the U.S. Bureau of Labor Statistics (BLS), the Consumer Price Index rose 0.5% in May and 4.2% year-over-year — up from 3.8% in April — marking a significant re-acceleration in headline inflation. Core CPI (excluding food and energy) came in at 2.9% YoY, confirming that price pressure extends beyond the energy sector. The energy index was the key short-term accelerator, rising 3.9% in the month alone, consistent with elevated geopolitical risk in the Middle East amplifying energy costs. This print substantially complicates the Federal Reserve's rate-cut timeline and is being treated by markets as a macro inflation risk-off repricing event.
The reading feeds directly into the stagflation risk & geopolitical inflation shock narrative: growth expectations remain fragile while headline inflation is now running more than double the Fed's 2% target. Higher-for-longer monetary policy repricing is the dominant transmission mechanism across all asset classes.
Leverage Impact Analysis
WTI Light Crude Oil is trading at $91.50 (24h range: $88.28–$92.71, +1.95%). This is the sharpest leverage-relevant setup in this report.
Long WTI CFD scenario: A trader entering a 50x long WTI CFD at $91.50 controls $4,575 of notional per lot with ~$91.50 margin. A move to $92.71 (24h high) yields +$60.50/lot — a +66% return on margin. However, a pullback to $88.28 (24h low) produces a -$161/lot loss, wiping out margin 1.7× over at 50x. The $88.28 intraday low is the critical liquidation watch zone for aggressive long positions.
Short equity/indices CFD scenario: A 20x short US500 CFD faces acute squeeze risk if the market rallies on "inflation peak" narratives. Traders short Nasdaq-100 CFDs must monitor whether real-yield repricing overrides any energy-equity offset.
For CPI-driven setups, check live funding rates on CoinUnited.io — elevated volatility regimes typically widen funding cost, compressing net P&L on held positions. Given the CPI shock & central bank repricing dynamics, intraday stop discipline is critical at high multiples.
Cross-Market Impact
Commodities: WTI and Brent Crude Oil are direct beneficiaries of energy-led inflation. Gold faces a competing narrative — geopolitical and inflation support vs. rising real yield headwinds. Monitor the gold vs. USD inverse relationship for direction.
Forex: The USD is the primary FX beneficiary as markets price a more hawkish Fed path relative to other central banks. EUR/USD faces downward pressure; USD/JPY may extend gains as the yen remains yield-disadvantaged. This intersects directly with Fed macro policy crossroads positioning.
Equities/Indices: Growth stocks and the Nasdaq-100 are most vulnerable — higher discount rates compress multiples. Airlines, transport, and consumer discretionary sectors face margin pressure from elevated fuel costs. Energy equities are the isolated beneficiary.
Crypto: Bitcoin and Ethereum face headwinds from dollar strength and rising real yields, though geopolitical safe-haven flows can provide short-term support. The oil shock & geopolitical risk-off theme remains active for crypto correlations.
Trading Considerations
WTI's key near-term levels: $88.28 (24h low / intraday support), $91.50 (current), $92.71 (24h high / resistance). A sustained break above $92.71 opens the door to further momentum plays, while a failure back below $90 would signal profit-taking. The Hormuz Strait energy supply shock theme remains the primary upside catalyst — monitor any escalation or de-escalation signals closely.
For macro-driven positions, the next key event is Fed communication responding to this print. Traders positioned in rate-sensitive assets (long-duration bonds, growth equities, high-leverage crypto longs) should size conservatively until the Fed's reaction function is clearer.
Trade WTI Light Crude Oil on CoinUnited.io
Trade WTI with up to 1000xx leverage → | Create Free Account
Frequently Asked Questions
It's a direct tailwind — energy drove the print, and WTI is already up 1.95% to $91.50. However, 50x+ longs must monitor the $88.28 intraday low as the key liquidation threshold; a reversal on profit-taking could compress that buffer quickly.
Continue Exploring
Disclaimer: This brief is for educational purposes only and is not investment advice.