Quick Links
NASDAQ Breaks 200-Day MA Again — S&P 500 Hangs by a Thread at 6,615: Leverage Risk Escalates
Data Snapshot
Key Takeaways
- •NASDAQ is already below its 200-day MA (~22,223), with the next downside target at the November low of 21,898 — a break there confirms a deeper corrective phase.
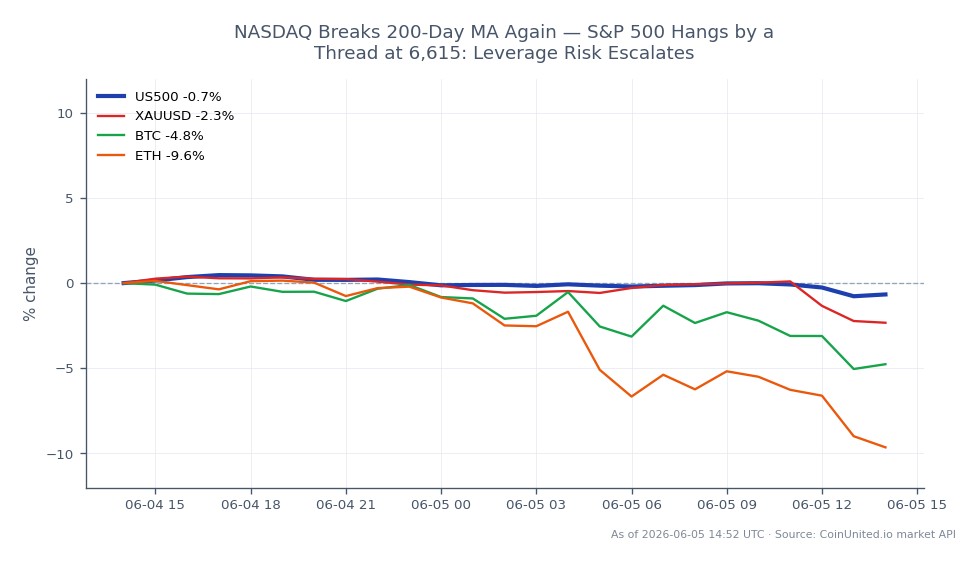
- •S&P 500 sits at a critical inflection: 6,624.70 close vs. 6,615.70 MA — futures implied a ~56-point opening decline that risks confirming the breakdown.
- •Leverage risk is acute: a 50x long US500 CFD opened near the 24h high of $7,574 faces a ~43% margin drawdown at current prices ($7,508.55) with further downside to November lows.
- •Cross-market spillover is likely if both indices confirm 200-day breaks — Gold and USD benefit as safe havens, while Bitcoin and Ethereum face correlated selling pressure.
- •The last time both indices closed below their 200-day MAs simultaneously was May 2025, during a >20% drawdown — systematic CTA de-risking could amplify any initial move.
According to InvestingLive, the NASDAQ Composite closed at approximately 22,152 — below its 200-day moving average of ~22,223 — marking the second close beneath that level in just four trading session
Event Summary
According to InvestingLive, the NASDAQ Composite closed at approximately 22,152 — below its 200-day moving average of ~22,223 — marking the second close beneath that level in just four trading sessions, with a daily decline of -1.46%. The S&P 500 Index closed at 6,624.70, barely above its own 200-day MA at 6,615.70, while futures signaled an opening decline of ~56 points that would push it back below that threshold.
The last time both indices closed decisively below their respective 200-day MAs was May 2025, a period associated with a greater-than-20% drawdown. That historical parallel is now front of mind for institutional desks and systematic strategies tracking trend signals.
Leverage Impact Analysis
The 200-day MA break is a mechanical trigger for trend-following and CTA models — meaning leveraged index CFD traders face asymmetric risk if the breakdown confirms.
Long scenario under pressure: A trader holding a 50x long US500 CFD entered at $7,574 (24h high) now sits at $7,508.55 — a 0.86% adverse move. At 50x, that's a 43% drawdown on margin. If the S&P follows the NASDAQ below its 200-day (~6,615 equivalent) and tracks toward the November low at 6,521, the index-level drop from current prices would exceed 1.3%, wiping out a 50x long position opened near today's high entirely.
Short opportunity framing: Traders positioning short on the NASDAQ (already below its 200-day) face a cleaner technical backdrop, but the key risk is a false breakdown. A strong recovery close above 22,223 on the NASDAQ would constitute a bear trap — at 50x leverage, even a 0.5% snap-back rally produces a 25% margin hit.
Given the Fed macro policy crossroads backdrop — where rate cut timing remains uncertain — leverage traders should monitor daily closes, not intraday prints, as the operative signal. Check live funding rates on CoinUnited.io before sizing positions in index perpetuals.
Cross-Market Impact
This technical event has real cross-asset read-throughs. The 2026 Global Indices Outlook notes that NASDAQ weakness disproportionately reflects growth and tech sector fragility, while the S&P's relative resilience points to value and defensive rotation.
Gold: A confirmed risk-off shift historically supports Gold as a safe-haven. The gold vs. USD relationship becomes particularly relevant if equity vol spikes.
Crypto: Bitcoin and Ethereum trade as high-beta risk assets. Per the 2026 Crypto Market Outlook, sustained equity risk-off typically triggers correlated outflows from crypto. Bitcoin CFD and perpetual traders should watch for correlation tightening if the S&P decisively loses 6,615.
Forex: USD may find safe-haven demand, pressuring risk-sensitive pairs. The macro inflation and cross-sector liquidity flows angle suggests defensive FX positioning gains appeal in this environment.
Trading Considerations
Key levels to watch: NASDAQ 22,223 (200-day, resistance if reclaimed), 21,898 (November low, downside confirmation). S&P 500: 6,615 (200-day, current battleground), 6,521 (November low, structural support). The US500 live price of $7,508.55 reflects current futures pricing — traders should note the 24h low of $7,494.05 as immediate near-term support.
Invalidation of the bearish setup requires a high-volume daily close above both 200-day MAs. Until that occurs, the macro inflation risk-off repricing theme remains the dominant regime.
Trade S&P 500 Index on CoinUnited.io
Trade US500 with up to 2000xx leverage → | Create Free Account
Frequently Asked Questions
From the current price of $7,508.55, a move to the November low equivalent (~6,521 index level) represents roughly a 1.3%+ decline — at 50x leverage, that exceeds the margin on most standard position sizes, triggering liquidation before the target is reached. Size positions so a 2% adverse move is survivable.
Continue Exploring
Disclaimer: This brief is for educational purposes only and is not investment advice.