Hızlı Bağlantılar
Gold Near 7-Month Low: Hawkish Fed & Dollar Strength Create Leveraged Metals Liquidation Risk
Veri Anlık Görüntüsü
Ana Çıkarımlar
- •Gold has dropped ~11.7% over four weeks to a 7-month low (~$4,000–$4,100/oz), driven entirely by hawkish Fed repricing and stronger real yields — not idiosyncratic gold factors.
- •Leveraged long Gold CFDs face acute liquidation risk: a 50x long opened at $4,200 is already past margin wipeout on current drawdown; size positions accordingly.
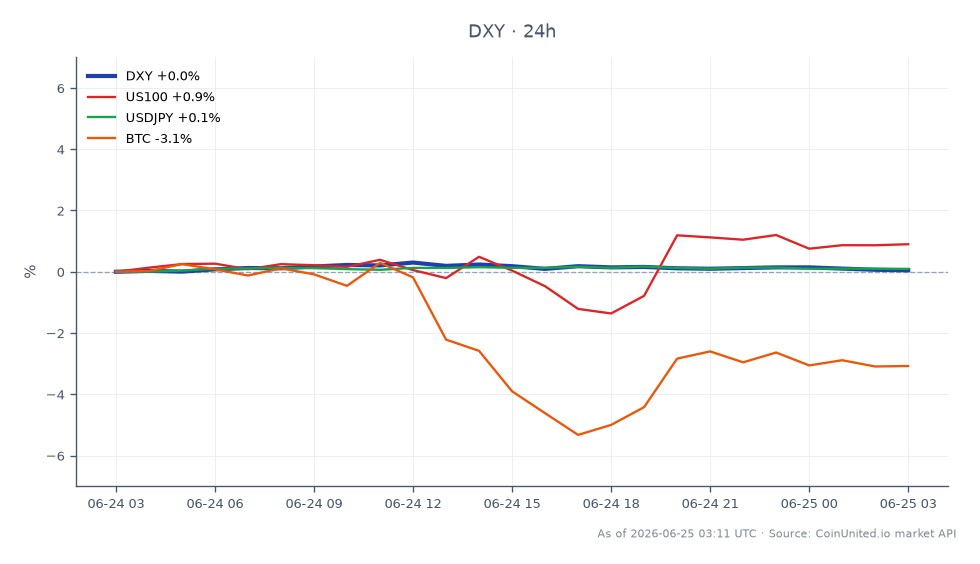
- •DXY at $101.51 is the real-time leading indicator — sustained dollar strength is bearish for gold; watch for DXY reversals as early warning of a gold mean-reversion bounce.
- •Cross-market spillover is broad: hawkish Fed headwinds hit EUR/USD, NASDAQ-100 growth stocks, Bitcoin's store-of-value bid, and gold mining equities simultaneously.
- •Gold remains up ~21–23% over 12 months — longer-term buyers may emerge aggressively on any dovish data surprise, making stops essential for short positions near key support.
Gold has fallen to approximately $4,000–$4,100/oz, its lowest level since November 2025 — a roughly 7-month low — as reported by Trading Economics and corroborated by multiple commodity data providers
Event Summary
Gold has fallen to approximately $4,000–$4,100/oz, its lowest level since November 2025 — a roughly 7-month low — as reported by Trading Economics and corroborated by multiple commodity data providers. The metal is down approximately 11.7% over the past four weeks, driven by a hawkish US Federal Reserve outlook that has lifted real yields and strengthened the US dollar. According to macro commentary aggregated by Trading Economics, futures markets currently price no Fed rate cuts in 2026 and assign a non-trivial probability to a further hike — a policy stance that raises the opportunity cost of holding non-yielding bullion. Despite the sharp pullback, gold remains up roughly 21–23% over 12 months, signaling a correction within a longer-term uptrend rather than a structural breakdown. The Fed Macro Policy Crossroads dynamic — higher real yields plus a stronger DXY — is the primary transmission mechanism pressuring gold.
Leverage Impact Analysis
This environment is high-risk for leveraged gold longs. Consider a trader holding a 50x long Gold CFD opened at $4,200/oz on CoinUnited.io. An 11.7% drawdown to ~$4,100 translates to a 585% loss on margin at 50x — well past liquidation for most position sizes. Even at 10x leverage, the same move consumes 117% of margin, triggering a full wipe.
For short-side traders, the setup is more constructive but carries reversal risk. A 20x short Gold CFD at $4,100 profits ~234% if gold extends down another 5% to ~$3,895 — but a single dovish data surprise (soft CPI, weak NFP) could trigger a violent mean-reversion squeeze, as longer-term bulls see value near 7-month lows.
Key risk: the FOMC Inflation Policy Crossroads means that any scheduled macro print (CPI, PCE, NFP) is a binary volatility event for gold. Monitor funding rates and open interest on CoinUnited.io before sizing positions. The gold vs. US dollar inverse relationship makes DXY the real-time leading indicator — watch DXY (currently $101.51, 24h range $101.48–$101.65) for directional confirmation.
Cross-Market Impact
Forex: A hawkish Fed supports USD broadly. EUR/USD and USD/JPY are primary channels — stronger dollar weighs on EUR/USD while USD/JPY remains elevated near multi-decade highs (see USD/JPY leverage flashpoints). AUD/USD also faces headwinds as a commodity and carry currency.
Equities: Rising real yields are a headwind for long-duration growth stocks. The NASDAQ-100 and S&P 500 face rate-driven multiple compression, while US financials may outperform on net interest margin support.
Crypto: Bitcoin's "digital gold" narrative faces pressure in a high-real-yield environment. When gold drops on tighter liquidity, Bitcoin often follows as speculative risk appetite contracts. Watch BTC/gold correlation for confirmation of broader risk-off dynamics.
Mining stocks: High-cost gold producers face margin compression at current price levels; sector ETFs may underperform broad indices by 2–3x gold's percentage decline.
Trading Considerations
The tactical bias in gold remains bearish while real yields and DXY stay elevated. Key levels to watch: the $4,000 psychological floor is critical — a sustained break opens a path toward prior support near the $3,800–$3,900 range. Resistance on bounces sits near $4,200–$4,300 (former support, now flipped). For a macro inflation and risk-off context, the primary triggers to monitor are upcoming US CPI/PCE prints, FOMC communications, and any shifts in 10-year real yield trajectory. Gold's 12-month uptrend means dip-buyers may emerge aggressively on any dovish surprise — making two-sided risk management essential at current levels.
Trade U.S. Dollar Currency Index on CoinUnited.io
Trade DXY with up to 2000xx leverage → | Create Free Account
Sıkça Sorulan Sorular
At 10x leverage, an 11.7% drawdown already exceeds margin — any position opened near $4,200 with 10x or more is at high liquidation risk at current ~$4,100 levels. Traders should use 5x or less and set hard stops above key support levels.
Keşfetmeye Devam Et
Feragatname: Bu özet yalnızca eğitim amaçlıdır ve yatırım tavsiyesi değildir.