Snabblänkar
Bitcoin Slides to $64K as Hawkish Fed Dominates — Iran De-escalation Offers No Relief for Leveraged Longs
Datasnapshot
Viktiga punkter
- •BTC is trading at $64,016, down 2.71%, with the 24h low of $63,660 acting as the immediate liquidation trigger level for highly leveraged longs opened above $65,000.
- •Hawkish Fed signals — 'higher for longer' language and dot-plot risks — are the primary driver; Iran de-escalation is a secondary oil/EM FX story with limited BTC transmission.
- •At 100x leverage, a position opened at $66,000 has already exceeded typical liquidation thresholds; even 50x longs from $65,500 are under acute margin stress.
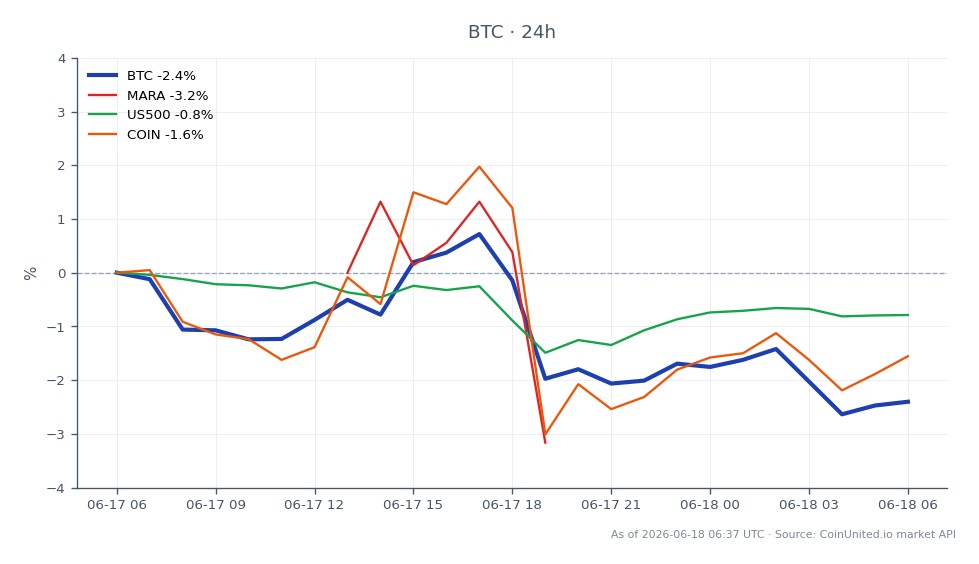
- •Cross-market: MSTR, COIN, and MARA face dual pressure from lower BTC spot AND multiple compression from higher real yields — amplified drawdowns vs. BTC spot.
- •Gold faces a hawkish real-yield headwind while losing some geopolitical bid from Iran de-escalation — watch DXY strength as the confirming signal.
Bitcoin is trading at $64,016 (24h range: $63,660–$64,780), down 2.71% as hawkish Federal Reserve signals weigh on risk assets. According to macro commentary aggregated across multiple market briefing
Event Summary
Bitcoin is trading at $64,016 (24h range: $63,660–$64,780), down 2.71% as hawkish Federal Reserve signals weigh on risk assets. According to macro commentary aggregated across multiple market briefings, the FOMC's "higher for longer" posture — including dot-plot language suggesting fewer 2026 cuts and no urgency to ease — is driving real yields higher and compressing liquidity expectations across crypto and growth equities.
A parallel Iran de-escalation development has provided modest relief to oil risk premia, but as current market analysis confirms, Fed policy and liquidity now dominate Bitcoin's macro trade, overriding any geopolitical tailwind. The net result: BTC is testing critical support in the $63,660–$65,000 band with the downside bias intact.
Leverage Impact Analysis
The $63,660–$64,016 zone is a high-stress area for leveraged longs opened during the recent rally. Consider the following scenarios using live price data:
Scenario A — High-Leverage Long Under Pressure: A trader who opened a 100x BTC perpetual long at $66,000 has absorbed a ~3% adverse move. At 100x, a 1% move equals 100% of margin — this position is already past typical liquidation thresholds unless margin was added. Even at 50x, a position opened at $65,500 is seeing ~2.9% drawdown against a ~2% liquidation buffer.
Scenario B — Short-Side Risk: Traders holding 50x BTC shorts from above $65,000 are in profit, but a sudden Iran-driven oil relief rally or Fed pivot surprise could trigger a rapid squeeze. Monitor funding rates on CoinUnited.io — persistently negative funding would signal growing short crowding and squeeze risk.
Key level: A confirmed break below $63,660 (24h low) opens a volume profile void toward the high-$50Ks based on prior macro-driven corrective patterns. ETF outflows persisting alongside hawkish repricing amplifies this risk for leveraged longs. The crypto derivatives landscape demands tighter position sizing in this regime.
Cross-Market Impact
Equities: Hawkish Fed repricing compresses multiples for growth/tech. Crypto-proxy stocks face dual pressure — lower BTC spot and higher discount rates. MicroStrategy (MSTR) carries compounded risk given its leveraged BTC treasury model. Coinbase (COIN) and Marathon Digital (MARA) face earnings multiple compression. The S&P 500 faces headwinds from higher real yields hitting long-duration names.
Gold: Higher real yields from a hawkish Fed are structurally negative for Gold (XAU/USD), though the Iran de-escalation removes some flight-to-safety bid. The gold/USD inverse relationship means a stronger DXY adds further headwind.
Energy/Oil: Iran de-escalation compresses crude risk premium — bearish for WTI near-term. However, the Iran de-escalation energy trade pivot is largely an oil/EM FX story with limited BTC transmission unless it materially shifts the inflation outlook.
FX: Hawkish Fed supports USD broadly, pressuring EM currencies and commodity FX. This creates additional headwinds for dollar-denominated risk assets including crypto.
Trading Considerations
Key support sits at $63,660 (24h low); a sustained break targets the $60,000–$62,000 zone where prior macro analysis identifies structural demand. Resistance is at $64,780 (24h high) and $65,500. Watch 2Y–5Y US Treasury yields and Fed funds futures for repricing signals — these are the leading indicators for BTC direction in this regime. Monitor crypto funding rates and open interest divergence for signs of capitulation or squeeze setup. ETF flow data remains a critical confirmation signal; persistent outflows alongside hawkish macro increase probability of a deeper corrective move.
Trade Bitcoin on CoinUnited.io
Trade BTC with up to 2000xx leverage → | Create Free Account
Vanliga Frågor
Based on live data, $63,660 is the immediate 24h support floor — a sustained break targets the $60,000–$62,000 range where structural demand was previously identified. Positions with over 20x leverage opened above $65,000 are already at or past typical liquidation thresholds.
Fortsätt Utforska
Ansvarsfriskrivning: Denna sammanfattning är endast för utbildningsändamål och utgör inte investeringsrådgivning.