Быстрые ссылки
Bitcoin's Three-Way Tug-of-War: ETF Outflows vs. Fed Hawkishness vs. MSTR Accumulation — Leverage Risk Map
Снимок данных
Основные выводы
- •Leveraged BTC longs face liquidation risk within ~2% of entry at 50x leverage; the $100M+ ETF outflow streak and hawkish Fed repricing are the primary catalysts — reduce position size until direction is confirmed.
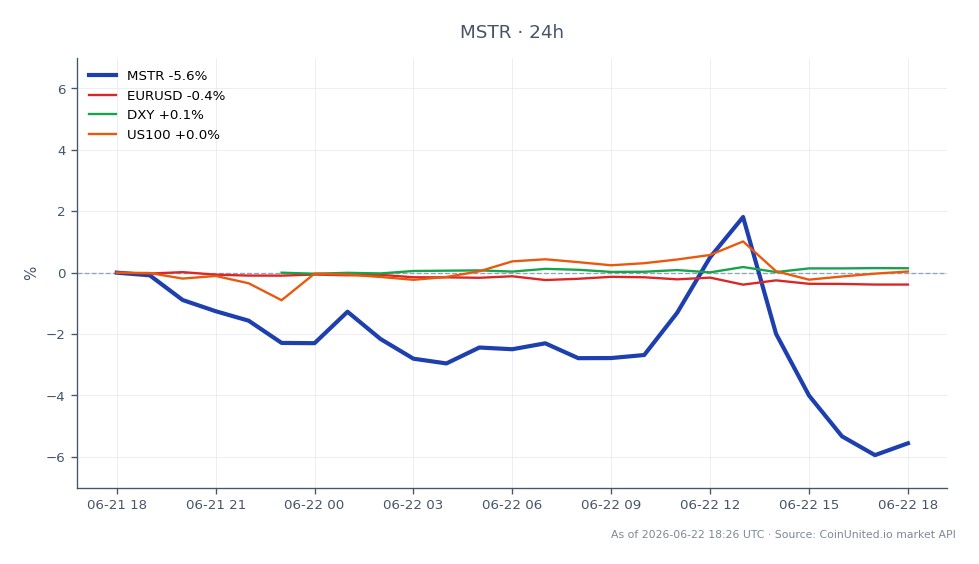
- •MSTR stock (at $110.37, -3.18% intraday) is showing high-beta BTC behavior with a $10.77 intraday range — 20x+ MSTR CFD positions opened near the $120 daily high are under significant stress.
- •The hawkish Fed path (multi-hike repricing) is bearish across crypto, growth equities, and EURUSD simultaneously — DXY strength compounds BTC downside pressure.
- •ETF flow inflection points (outflow-to-inflow regime change) have historically front-run BTC trend reversals — this is the primary signal to monitor for a directional trade.
- •Miner stocks (MARA, RIOT) face compounded risk: BTC price weakness plus post-halving margin compression make them the highest-beta expression of the bearish scenario.
Bitcoin is currently caught between three competing forces. According to CoinGlass, U.S. spot Bitcoin ETFs recorded net outflows exceeding $100 million over the past five trading days, with prior sing
Event Summary
Bitcoin is currently caught between three competing forces. According to CoinGlass, U.S. spot Bitcoin ETFs recorded net outflows exceeding $100 million over the past five trading days, with prior single-day episodes reaching hundreds of millions — translating into direct mechanical sell pressure on BTC spot markets. Simultaneously, rates markets are repricing toward a more hawkish Federal Reserve path, with the narrative shifting toward multiple additional hikes, lifting real yields and the USD. Partially offsetting this, MicroStrategy (MSTR) continues its pattern of large-scale BTC balance sheet accumulation, per ongoing public filings — part of the broader bitcoin corporate treasury accumulation theme that has structured corporate BTC demand as a recurring buyer.
The net directional bias for BTC depends on which force dominates: cumulative ETF outflows and Fed tightening expectations versus MSTR's absorbing demand. This is a live, requires-confirmation setup — not a resolved trend.
Leverage Impact Analysis
This three-way collision creates elevated liquidation risk for leveraged BTC perpetual positions in both directions.
Long-side risk: A trader holding a 50x long BTC perpetual opened at $105,000 faces liquidation with roughly a 2% adverse move (~$103,000 liquidation threshold, before fees). If ETF outflows accelerate and real yields spike simultaneously, BTC can cover that range in minutes. According to CoinGlass flow data, multi-day outflow streaks have historically coincided with sharp BTC drawdowns. Monitor crypto funding rates on CoinUnited.io — elevated positive funding in this environment signals crowded longs vulnerable to a squeeze.
Short-side risk: A 50x short BTC position opened at $105,000 faces liquidation near $107,100 (~2% up). MSTR's announced BTC purchases have historically triggered sharp short-covering rallies in BTC and outsized moves in MSTR stock CFDs. MSTR itself is trading at $110.37 (down 3.18% on the day per live data), its intraday low at $109.23 vs. high of $120.00 — a $10.77 intraday range illustrating the violent two-way risk. A 20x long MSTR CFD opened at $120.00 is already underwater and approaching stress levels at current prices.
Position sizing guidance: Given three simultaneous macro drivers with unresolved net direction, position sizing should be reduced relative to single-catalyst setups. Check open interest divergence for confirmation before adding leverage.
Cross-Market Impact
The Fed macro policy crossroads dynamic ripples broadly. A hawkish repricing toward multiple hikes strengthens the DXY and pressures EURUSD — this is consistent with the Fed & ECB policy divergence repricing theme, as the ECB faces a different inflation trajectory. Rising real yields simultaneously compress the NASDAQ 100 by raising discount rates on growth assets — and crypto trades as a high-duration risk asset in this framework.
Crypto-proxy equities face amplified pressure. Marathon Digital Holdings and RIOT act as high-beta BTC with miner-margin compression layered on top — post-halving block subsidies make sustained BTC weakness especially damaging. Coinbase faces a revenue headwind if ETF outflow sentiment reduces trading volumes. Gold (XAUUSD) faces a cross-current: hawkish Fed is bearish for non-yielding gold, but risk-off sentiment from equity weakness can provide partial support.
Trading Considerations
The key quantitative signal to watch: compare cumulative ETF net outflows vs. estimated MSTR BTC additions over the same rolling window, then overlay the delta in Fed funds futures pricing and 10Y real yields (TIPS). If ETF outflows are materially larger than MSTR accumulation and real yields are rising, net BTC bias remains bearish. An inflection from outflow to inflow regime in ETF flows — particularly from the largest AUM issuers — has historically front-run BTC trend reversals.
For MSTR specifically, the NAV premium/discount to implied BTC-per-share is the key relative-value signal. The MSTR Bitcoin leverage model explains how equity-funded BTC purchases tighten the BTC-MSTR correlation while adding dilution risk — a spread trade (long BTC / short MSTR or vice versa) around perceived valuation gaps is a viable structure for sophisticated traders.
Trade MicroStrategy Inc on CoinUnited.io
Trade MSTR with up to 500xx leverage → | Create Free Account
Часто задаваемые вопросы
Multi-day ETF outflows create sustained mechanical sell pressure on BTC spot, which cascades into perp funding rates and liquidation levels — at 50x leverage, even a 2% BTC move triggers liquidation, so outflow-driven dips can wipe highly leveraged longs rapidly. Monitor funding rates on CoinUnited.io; elevated positive funding signals crowded longs at risk of a squeeze.
Продолжить исследование
Отказ от ответственности: Этот бриф предназначен только для образовательных целей и не является инвестиционной рекомендацией.