Быстрые ссылки
USD/CAD Stalls at 1.3710 Resistance — Leverage Squeeze Risk as Sellers Defend the 100-Day MA
Снимок данных
Основные выводы
- •USD/CAD stalled at the 1.3708–1.3720 resistance band (100-day MA), with active sellers rotating price lower from ~1.3710.
- •Leveraged longs above 50x face liquidation risk within ~36 pips of the entry near 1.3680 — position sizing is critical at this inflection.
- •Near-term support sits at 1.3660, with deeper support at 1.3631; a break above 1.3720 on volume would flip the bias bullish.
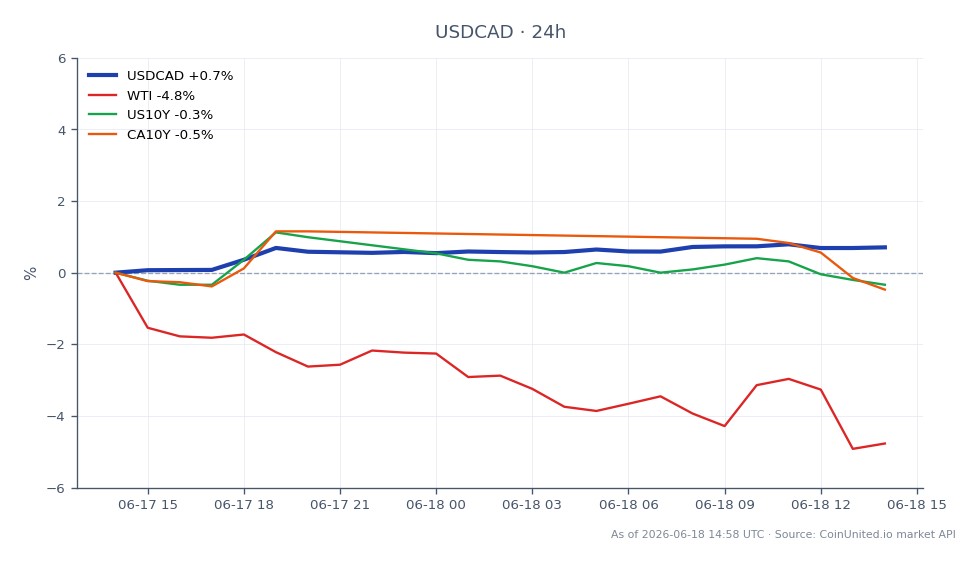
- •WTI crude oil strength would reinforce CAD firmness and add downside pressure on USD/CAD — cross-market confirmation matters here.
- •U.S. PCE inflation and Canadian labor data are the next binary catalysts that could either validate or negate the technical rejection.
As reported by InvestingLive and corroborated by multiple technical sources, USD/CAD pushed into a well-defined resistance cluster between 1.3708 and 1.3720 — near the 100-day moving average — and enc
Event Summary
As reported by InvestingLive and corroborated by multiple technical sources, USD/CAD pushed into a well-defined resistance cluster between 1.3708 and 1.3720 — near the 100-day moving average — and encountered active selling pressure, rotating lower from approximately 1.3710. According to live market data, the pair is currently trading at $1.41, reflecting the broader trend context while the resistance zone remains a key structural ceiling.
The technical rejection follows a backdrop of diverging labor data: a better-than-expected U.S. jobs report and a weaker Canadian jobs print. Traders are also watching upcoming U.S. PCE inflation and Canadian labor releases, per the cited commentary, which could serve as the fundamental catalyst to either confirm or negate the technical rejection.
Leverage Impact Analysis
The 1.3708–1.3720 resistance band is a high-risk zone for leveraged long USD/CAD positions. At current levels near 1.41, the broader trend remains USD-supportive, but the intermediate resistance rejection creates a two-sided squeeze risk:
Long squeeze scenario: A trader holding a 100x long USD/CAD CFD entered near 1.3680 faces a liquidation buffer of roughly 36 pips (0.27%) at 100x leverage — meaning a move back to 1.3644 would approach margin exhaustion. With price stalling at 1.3710, that buffer is already partially consumed.
Short opportunity for faders: Traders fading the resistance at 1.3710–1.3720 with a 50x short CFD targeting 1.3660 (next key support) have a ~50-pip potential move — roughly 0.37% — before support is tested. At 50x, that translates to an ~18.5% gain on margin, but stop placement above 1.3725 is critical to avoid a breakout squeeze.
The FOMC inflation policy crossroads environment keeps USD directional bets elevated in volatility, making position sizing at leverage above 50x particularly sensitive to macro data surprises. Monitor the Fed macro policy crossroads theme for rate-path signals that could trigger a directional break.
Cross-Market Impact
CAD Index & Oil: The Canadian Dollar Currency Index closely mirrors USD/CAD dynamics. A sustained rejection at resistance implies relative CAD firmness, which historically correlates with WTI Light Crude Oil — elevated oil prices structurally support CAD. Traders should monitor WTI for confirmation: oil strength undermines the USD/CAD long thesis.
DXY & U.S. Rates: The U.S. Dollar Currency Index directional bias feeds into USD/CAD. If DXY softens post-PCE data, USD/CAD downside to 1.3631 becomes a higher-probability scenario. Watch the United States 10 Year Yield — a drop in U.S. yields would weaken the USD carry advantage against CAD.
Canada Yields: The Canada 10 Year Yield spread versus U.S. equivalents is a live proxy for BoC-vs-Fed policy divergence. A narrowing spread (CAD yields rising) would pressure USD/CAD lower, reinforcing the technical rejection signal. For deeper macro inflation trading context, the rate differential is the primary structural driver.
Trading Considerations
Key levels to watch: Resistance at 1.3708–1.3720 (100-day MA); immediate support at 1.3660; deeper support at 1.3631 (200-hour and 100-hour MAs). A confirmed daily close above 1.3720 would shift bias bullish and expose leveraged shorts to a squeeze.
Risk factors: Upcoming U.S. PCE and Canadian labor data are binary event risks. High-leverage positions (above 50x) ahead of these releases carry significant gap risk. Sellers controlling price since early April maintain the bearish structural bias unless 1.3720 breaks cleanly on volume.
Trade US Dollar / Canadian Dollar on CoinUnited.io
Trade USDCAD with up to 2000xx leverage → | Create Free Account
Часто задаваемые вопросы
At 100x leverage, a long entered near 1.3680 has roughly 36 pips of buffer before margin pressure intensifies — the stall at 1.3710 has already eroded most of that cushion. Traders should tighten stops above 1.3720 or reduce size ahead of PCE and Canadian labor data.
Продолжить исследование
Отказ от ответственности: Этот бриф предназначен только для образовательных целей и не является инвестиционной рекомендацией.