Быстрые ссылки
DXY Hits 1-Year+ High at $100.79 — Why the Dollar Rally May Be Running on Fumes
Снимок данных
Основные выводы
- •DXY is at $100.79 (1-year+ high), but systematic CTA crowding and fading rate-differential tailwinds make aggressive USD longs asymmetrically risky at current levels.
- •Leveraged short EUR/USD positions face squeeze risk: a 100–200 pip reversal at 50x leverage equates to a 5–10% rapid loss — position sizing and stop placement are critical.
- •Gold's resilience while DXY pushes higher signals weakening inverse correlation — a potential leading indicator that the dollar rally is in late-stage territory.
- •Bitcoin and risk assets historically benefit from a peaking/reversing DXY; watch for BTC correlation shift if dollar momentum stalls.
- •Cross-market: S&P 500 multinationals face USD earnings headwinds; a DXY reversal would disproportionately benefit large-cap tech and EM equities.
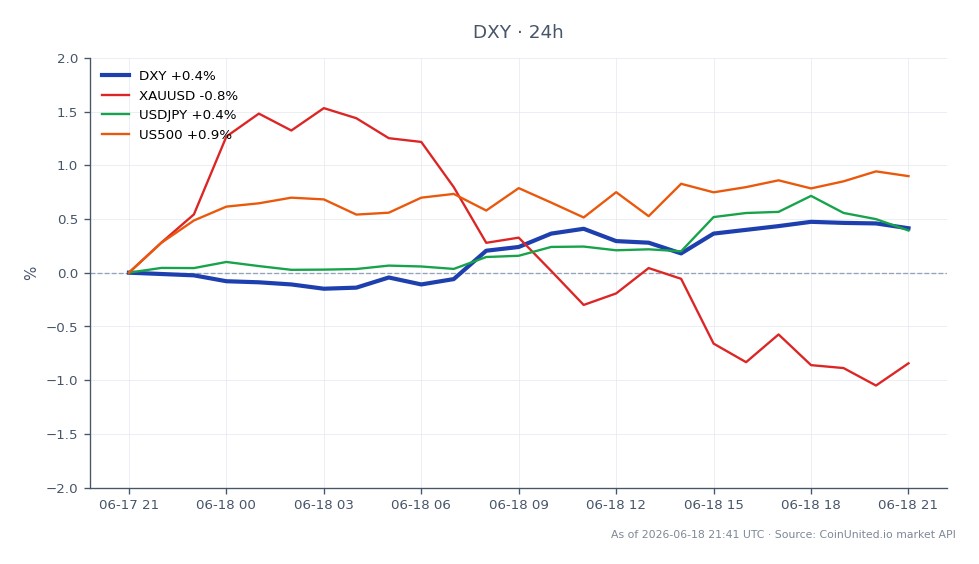
The U.S. Dollar Index (DXY) has pushed to its highest level in more than a year, with live market data showing DXY at $100.79 (24h high: $100.92, 24h low: $100.21, +0.41% on the day). The move reflect
Event Summary
The U.S. Dollar Index (DXY) has pushed to its highest level in more than a year, with live market data showing DXY at $100.79 (24h high: $100.92, 24h low: $100.21, +0.41% on the day). The move reflects sustained U.S. rate-differential dominance versus major peers, with systematic CTA flows amplifying the breakout. However, as explored in depth by macro analysts tracking the Fed Macro Policy Crossroads theme, a growing body of evidence suggests the rally is showing late-cycle characteristics rather than the early-stage momentum that warrants aggressive chasing.
The dollar's core structural driver — relative interest-rate differentials — may be near exhaustion. Markets tend to front-load the "higher for longer" narrative, meaning the marginal hawkish surprise is increasingly difficult to deliver. The Fed & ECB Policy Divergence Repricing dynamic that powered the dollar's ascent is narrowing as other central banks normalize.
Leverage Impact Analysis
For leveraged forex traders, DXY at a 1-year+ high creates asymmetric risk. Consider a 100x long EUR/USD position opened at 1.0850: a mere 50-pip adverse move (dollar continues higher) generates a ~4.6% margin drawdown — enough to trigger a margin call on underfunded accounts. Conversely, a mean-reversion snap of 150 pips (entirely plausible given stretched positioning) yields a ~13.8% gain on that same position.
On the short-EUR/USD (long-USD) side: traders holding 50x short EUR/USD near current levels face a crowded-trade squeeze risk. If U.S. data disappoint or the Fed signals any dovish tilt, systematic unwinds can move EUR/USD 100–200 pips in a session. At 50x, that's a 5–10% position loss within hours. Monitor open interest and funding on CoinUnited.io for real-time squeeze signals.
For USD/JPY longs, the risk-reward also skews unfavorably at 1-year highs: BOJ intervention risk rises with every new USD/JPY extension, and a 200-pip reversal at 100x leverage represents a ~18% drawdown depending on entry.
Cross-Market Impact
A stretched dollar rally creates negative feedback loops across multiple asset classes. Gold historically moves inversely to DXY — but notably, gold's resilience near highs while DXY pushes up suggests the inverse correlation is weakening, a classic late-cycle signal. If DXY rolls over, gold could see a sharp re-rating; our Gold vs. US Dollar trader's guide covers this dynamic in detail.
The S&P 500 faces a dual headwind: strong USD compresses multinational earnings (tech, pharma, consumer brands) AND tightens global financial conditions. If DXY stabilizes or reverses, U.S. large-cap multinationals and EM equities become tactical outperformers.
Bitcoin has historically traded inversely to the dollar during risk-on phases. A peaking DXY — combined with any Fed dovish pivot pricing — could be the macro catalyst that reignites crypto risk appetite. Watch BTC/USD correlation with DXY closely; a dollar reversal often precedes a crypto liquidity surge.
For the EUR/USD pair, the Fed & ECB Rate Patience Macro Repricing theme remains key: if ECB hawkishness persists while Fed cuts get priced in, EUR/USD recovery toward 1.10+ becomes viable.
Trading Considerations
Key levels: DXY resistance sits at the 24h high of $100.92; a confirmed close above opens room toward prior cycle highs, but failure here reinforces the "overdone" thesis. Support at $100.21 (24h low); a break below would signal short-term momentum exhaustion. Watch incoming U.S. growth and inflation prints — any miss accelerates CTA unwind risk. Position sizing at high leverage should account for elevated two-way volatility typical of late-cycle breakouts, where false breakouts and sharp reversals are common.
Trade U.S. Dollar Currency Index on CoinUnited.io
Trade DXY with up to 2000xx leverage → | Create Free Account
Часто задаваемые вопросы
Short EUR/USD (long USD) positions are currently profitable but sit in crowded-trade territory — systematic unwinds can reverse 100–200 pips rapidly. At 50x leverage, a 150-pip adverse move generates roughly a 7% loss, so tight stop management is essential.
Продолжить исследование
Отказ от ответственности: Этот бриф предназначен только для образовательных целей и не является инвестиционной рекомендацией.