Быстрые ссылки
Hawkish FOMC Dot Plot Triggers Cross-Asset Repricing — Leveraged Traders Face USD Surge, Gold Drop, and Crypto Deleveraging
Снимок данных
Основные выводы
- •FOMC dot plot shifted hawkish — fewer cuts signaled, with median projections clustering higher and strong committee consensus for restrictive policy.
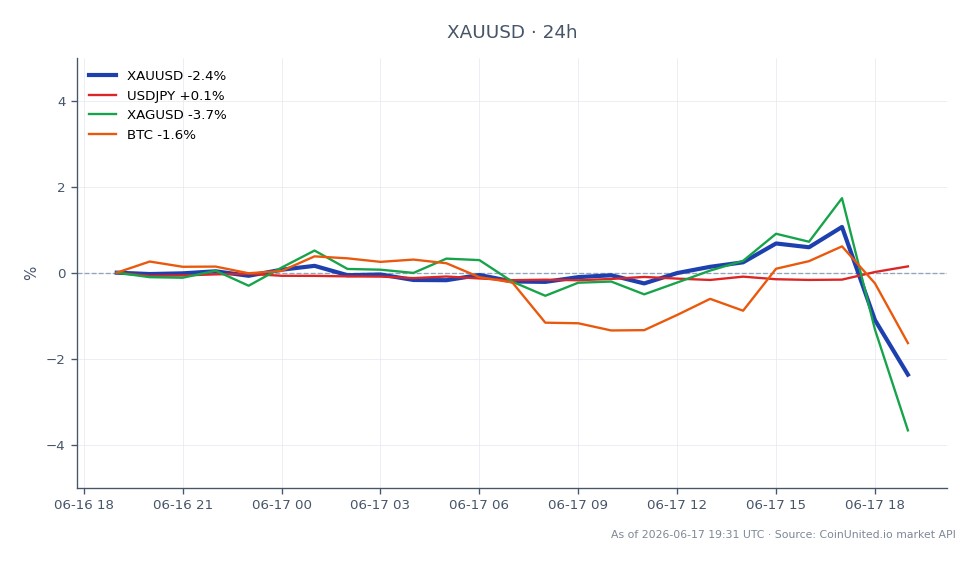
- •Gold dropped to $4,222.52 (–2.54%), breaking from a $4,382 daily high; leveraged XAUUSD longs opened above $4,280 at 50x face near-full margin wipeout.
- •USD strengthens across G10 — EURUSD and USDJPY are primary forex expression vehicles; 100x leveraged forex positions face rapid margin erosion on even 20–30 pip moves.
- •BTC, ETH, and high-beta crypto face deleveraging pressure as hawkish Fed tightens global liquidity conditions — monitor funding rates and open interest before re-entry.
- •Cross-market: Nasdaq 100 and S&P 500 growth/tech components are most rate-sensitive; historical hawkish FOMC tones linked to average –3.5% equity moves per the research report.
The Federal Reserve's latest FOMC statement and Summary of Economic Projections (dot plot) delivered a hawkish shift, signaling fewer or later rate cuts than markets had previously priced. According t
Event Summary
The Federal Reserve's latest FOMC statement and Summary of Economic Projections (dot plot) delivered a hawkish shift, signaling fewer or later rate cuts than markets had previously priced. According to the Federal Reserve's official release, the dot plot shows an upward revision to median rate projections, with strong committee consensus clustering around higher-for-longer policy. Fed Chair Powell's press conference reinforced this stance, emphasizing elevated inflation risks and conditioning any further easing on clear disinflation data. The federal funds rate has recently been held in the 3.50–3.75% range, and the new dots suggest limited cuts ahead.
The FOMC inflation policy crossroads is now the dominant macro driver across all asset classes. The alpha lies in the gap between prior market pricing and the updated dot distribution — a hawkish cluster of policymaker projections carries more weight than the decision alone, and any dissents from dovish members further tighten the perceived reaction function per the research report.
Leverage Impact Analysis
This is a high-leverage-relevance event (0.96/1.0). Volatility spikes around FOMC prints are historically sharp and mean leveraged positions face outsized margin stress.
Gold (XAUUSD) — Live Price: $4,222.52 (–2.54% on the day, 24h High: $4,382.92)
Gold has already sold off sharply from its daily high as the hawkish shift lifts real yields and the DXY. A trader holding a 50x long XAUUSD CFD entered near the $4,382 daily high now faces a $160 adverse move — representing an ~1.83% spot decline that translates to ~91% loss on margin at 50x. Liquidation risk is live for longs opened above $4,280 at 50x leverage without additional margin buffer. Traders using CoinUnited.io's gold vs. US dollar CFD should monitor the $4,220 support closely — a break exposes the $4,100–$4,098 zone flagged in prior FOMC sessions.
Forex (EURUSD / USDJPY)
A hawkish Fed repricing strengthens the USD across G10. A 100x long EURUSD position opened at 1.0850 loses approximately $1,000 per pip at standard lot sizing — even a 30-pip adverse move wipes 30% of margin at 100x. USD/JPY typically spikes on higher U.S. yields; yen longs face particular squeeze risk given Japan's persistent low-rate regime. The Fed & ECB rate patience macro repricing theme points to EUR underperformance if ECB diverges toward cuts while the Fed holds.
Crypto
BTC and ETH trade as high-beta liquidity proxies. A hawkish Fed tightens global dollar liquidity — historically negative for risk assets. Check funding rates on CoinUnited.io and monitor open interest for confirmation that leveraged longs are being flushed before re-entry.
Cross-Market Impact
The Fed macro policy crossroads creates a textbook risk-off rotation. Equities face disproportionate pressure in growth and long-duration names — Nasdaq 100 and S&P 500 CFDs are vulnerable, with tech and REIT sectors most rate-sensitive. According to the research report, historical hawkish FOMC tones correlate with average –3.5% equity price moves in stable periods. Silver tracks gold lower as real yields rise. EM FX weakens broadly against the dollar. For a full breakdown of how Fed divergence moves EUR and commodity markets, see the Fed vs. ECB vs. Oil macro policy divergence guide.
Trading Considerations
Gold's immediate support sits at $4,220 (current 24h low). A sustained break opens the $4,098–$4,100 zone from prior sessions. Resistance is now the $4,382 daily high. For forex, watch DXY momentum — a sustained DXY bid confirms the hawkish repricing is being absorbed, not faded. For equities, the S&P 500 FOMC cycles guide notes that front-end yield moves above 10–15 bps on the 2Y are historically sufficient to pressure growth multiples meaningfully. Monitor whether Powell's language shifts toward data-dependence nuance — any dovish caveat can trigger a sharp short-cover rally across all risk assets.
Trade Gold / US Dollar on CoinUnited.io
Trade XAUUSD with up to 2000xx leverage → | Create Free Account
Часто задаваемые вопросы
Higher real yields and a stronger USD are structurally bearish for gold — a 2.54% spot drop translates to ~127% loss on margin at 50x leverage. Longs opened near the $4,382 daily high are at acute liquidation risk if $4,220 support breaks.
Продолжить исследование
Отказ от ответственности: Этот бриф предназначен только для образовательных целей и не является инвестиционной рекомендацией.