Hurtiglenker
Bitcoin's Iran Rally Enters a 60-Day Fed Test — What the $64,900 Level Means for Leveraged Traders
Datasnapshot
Viktige punkter
- •BTC is trading at $64,902 with a 24h low of $64,772 — 50x longs opened near $66,000 have consumed ~83% of initial margin and face liquidation on any further leg down.
- •The Iran de-escalation removes oil-shock risk but also eliminates a key argument for Fed dovishness, leaving BTC without a near-term macro catalyst.
- •Funding rates are the key signal to watch: a flip to negative would accelerate long liquidations and create a potential squeeze setup for short-sellers.
- •Crypto-proxy equities (MSTR, MARA, RIOT) carry amplified downside risk if BTC breaks below $63,000 — monitor these as leading indicators of institutional sentiment.
- •Cross-market: DXY strength and oil softness are both headwinds for BTC in the current regime; Gold may outperform as the safer Fed-hold hedge.
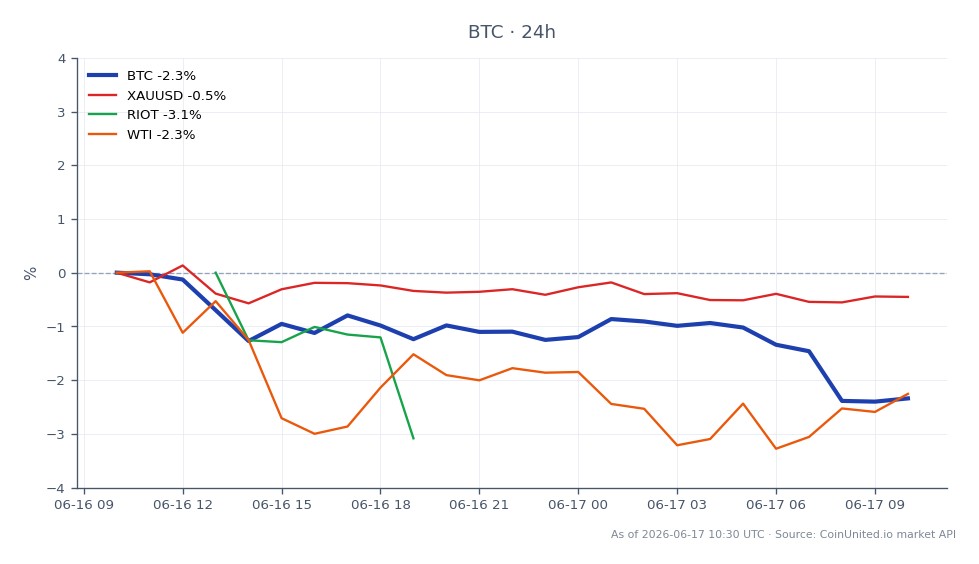
Bitcoin is trading at $64,902 as of this writing — down 2.38% on the day, with a 24-hour range of $64,772–$66,092 — as the geopolitical bid that drove a short-term rally on Iran de-escalation headline
Event Summary
Bitcoin is trading at $64,902 as of this writing — down 2.38% on the day, with a 24-hour range of $64,772–$66,092 — as the geopolitical bid that drove a short-term rally on Iran de-escalation headlines begins to fade. The market is now transitioning from a fear-driven, geopolitical premium phase into a macro patience phase dominated by Federal Reserve policy expectations. With no rate cut signaled in the near term, the next 60 days represent a stress test for BTC's ability to hold gains built on bitcoin's role as a geopolitical payment rail rather than macro tailwinds.
The shift reflects a broader Fed macro policy crossroads: markets had priced in a more dovish pivot, but sticky inflation — partly fueled by residual energy price uncertainty — is keeping the Fed in a holding pattern. The Iran de-escalation energy trade pivot has reduced immediate oil shock risk, but the knock-on effect is that a key catalyst for Fed dovishness (a sharp oil-driven demand slowdown) is also off the table.
Leverage Impact Analysis
With BTC at $64,902 and the 24h low at $64,772, the current range compression is dangerous for high-leverage longs. A trader holding a 100x long BTC perpetual opened at $65,500 is already approximately 0.92% offside — representing ~92% of margin consumed at 100x. Liquidation sits within $60–$130 of entry depending on position sizing.
For 50x longs opened near $66,000 (the recent high), the position is roughly 1.67% underwater — at 50x leverage, that's approximately 83% of initial margin eroded. The $64,772 intraday low is the critical near-term liquidation cluster zone.
Funding rates matter here: if BTC continues drifting lower under Fed-hold pressure, perpetual funding rates are likely to flip negative (shorts pay longs), which would pressure over-leveraged long books to unwind. Monitor funding rates and positioning squeeze risk closely before adding to longs. For shorts, the $66,092 high represents the immediate invalidation level — a reclaim there would squeeze 20x+ short positions rapidly.
Cross-Market Impact
The Fed & ECB oil-driven rate patience dynamic creates divergent signals across asset classes. With Iran de-escalation reducing the geopolitical premium in oil, Brent and WTI face downside pressure — which is disinflationary on paper but removes a key argument for early Fed cuts based on demand destruction.
Gold typically benefits from Fed hold scenarios as real yields stay elevated and dollar strength moderates — watch the gold/USD inverse relationship for confirmation. DXY holding firm is a headwind for BTC, as dollar strength historically compresses risk-asset multiples.
Crypto-proxy equities face pressure: MicroStrategy (MSTR) carries direct BTC NAV risk, with its Bitcoin premium vulnerable if spot continues softening. Marathon Digital and Riot Platforms have operational leverage to BTC price — a sustained move below $63,000 would materially compress their mining margins. The S&P 500 is caught between Iran relief (risk-on) and Fed hold (risk-off), creating a choppy, range-bound environment that typically reduces BTC correlation with equities.
Trading Considerations
Key levels: $64,772 (24h low / immediate support), $63,000 (structural support and Strategy's approximate average cost basis), $66,092 (24h high / resistance). A confirmed break below $64,772 on volume opens a move toward the $63,000 zone — a level that also represents significant corporate treasury cost basis and psychological support.
The 60-day Fed window means volatility is likely to remain compressed but with sharp episodic spikes on CPI prints, FOMC communications, or renewed geopolitical flare-ups. Reduce position sizing accordingly; the risk/reward for high-leverage directional bets is poor in low-volatility macro-wait regimes.
Trade Bitcoin on CoinUnited.io
Trade BTC with up to 2000xx leverage → | Create Free Account
Ofte stilte spørsmål
A 100x long opened at $65,500 is approximately 92% into margin drawdown at $64,902 — the $64,772 low is the immediate liquidation cluster. At 50x, longs from $66,000 have consumed roughly 83% of margin with liquidation risk below $64,700.
Fortsett Utforskningen
Ansvarsfraskrivelse: Denne briefen er kun for utdanningsformål og er ikke investeringsråd.