Quick Links
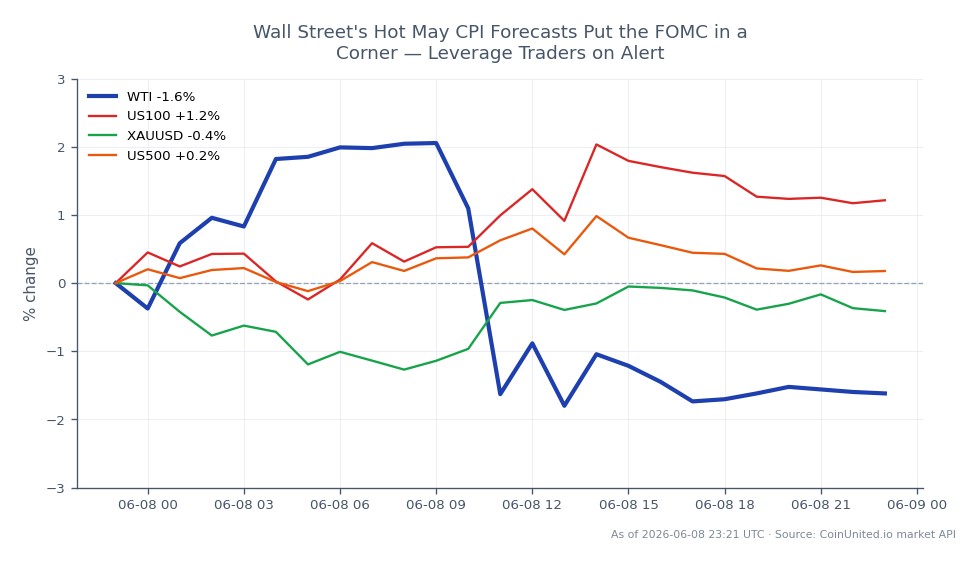
Wall Street's Hot May CPI Forecasts Put the FOMC in a Corner — Leverage Traders on Alert
Data Snapshot
Key Takeaways
- •April 2026 headline CPI already printed +0.6% m/m / 3.8% y/y with core at +0.4% m/m — the hottest monthly core reading since early 2025, per BLS.
- •The Philadelphia Fed's Survey of Professional Forecasters projects annualized current-quarter headline CPI at 6.0%, making a hot May print the path of least resistance.
- •Leverage traders face acute two-way risk: 100x EUR/USD shorts can be wiped by a cool surprise; 50x US100 longs face immediate margin pressure on a hot print via discount-rate repricing.
- •Cross-market: hot CPI is bearish for equities (especially Nasdaq tech), short-term bearish for BTC/ETH, bullish for USD, and ambiguous for gold given competing real-yield vs. inflation-hedge forces.
- •Forecast dispersion across the 15 banks is the key wildcard — tight clustering means pre-priced risk; wide dispersion means larger tail moves and greater liquidation cascade potential.
Approximately 15 major investment banks have published May 2026 CPI forecasts skewing decidedly hot, according to sell-side macro research circulated ahead of the official Bureau of Labor Statistics r
Event Summary
Approximately 15 major investment banks have published May 2026 CPI forecasts skewing decidedly hot, according to sell-side macro research circulated ahead of the official Bureau of Labor Statistics release. The backdrop is already uncomfortable: April 2026 headline CPI printed at +0.6% m/m and 3.8% y/y, with core CPI at +0.4% m/m and 2.8% y/y — the sharpest monthly core increase since early 2025. Energy contributed heavily (+3.8% m/m, +17.9% y/y), while shelter rose 0.6% m/m and food 0.5% m/m, per BLS data.
The Philadelphia Fed's Survey of Professional Forecasters already projects current-quarter headline CPI at an annualized 6.0%, with core at 3.2% — well above the Fed's 2% target. If May confirms the hot trajectory, the FOMC inflation policy crossroads becomes unavoidable: the dot plot either reprices toward fewer cuts, or the Fed risks a credibility hit.
Leverage Impact Analysis
This is a high-leverage-relevance event (signal score: 0.95). Volatility at the CPI print creates acute liquidation risk on both sides.
EUR/USD short example: A trader running a 100x short EUR/USD opened at 1.0800 risks rapid liquidation if CPI prints *cooler* than the hot consensus — a downside surprise would trigger USD selling and EUR/USD spikes of 80–150 pips intraday, which at 100x leverage can erase a 1% margin buffer almost instantly.
Conversely, hot print scenario: A 50x long DXY / short EUR/USD position benefits as rate differentials shift in USD's favor. A 0.1–0.2pp upside surprise in core CPI has historically driven 60–100 pip USD rallies within the first 30 minutes of release.
Equity index leverage: A 50x long US500 CFD opened near current levels faces immediate drawdown risk if hot CPI re-prices the Fed's easing path and triggers a discount-rate shock. High-multiple Nasdaq 100 constituents are most exposed — a 50x long US100 CFD amplifies even a 0.5% index move into a 25% margin swing. Monitor open interest for confirmation signals before the print.
The distribution of bank forecasts matters: if heavy consensus clustering exists around elevated numbers, some hot risk is already priced in — creating asymmetric downside for USD longs if the print disappoints.
Cross-Market Impact
The macro inflation risk-off repricing channel hits all five asset classes simultaneously:
- -Forex: Hot CPI = stronger USD. EUR/USD, AUD/USD, and EM FX under pressure. The Fed macro policy crossroads narrative supports bear flattening: 2y–5y UST yields rise more than 10y–30y, compressing carry.
- -Equities: Bearish for the S&P 500 Index and NASDAQ 100 Index via higher discount rates. Long-duration tech and AI-themed names face the steepest multiple compression.
- -Gold: The gold vs. USD inverse relationship becomes contested — persistent inflation supports the inflation-hedge bid, but higher real yields and a stronger dollar suppress price. Net: choppy, not directionally clean.
- -Crypto: BTC and ETH trade as high-beta macro assets here. Hot CPI + higher real yields = short-term bearish for Ethereum and BTC. The digital-gold narrative is a lagging, not leading, driver. Crypto-equity correlation typically rises in risk-off CPI shock episodes.
- -Oil/Commodities: Energy's outsized CPI contribution keeps WTI in focus — sustained energy inflation could support oil prices, intersecting with ongoing Hormuz Strait energy supply shock risk.
Trading Considerations
Key levels to watch: EUR/USD 1.0750 (near-term support) and 1.0900 (resistance if USD fades on a cool surprise). For US indices, a hot print likely tests recent support zones — check CPI inflation data trading guides for sector-specific setups. The primary risk factor is forecast dispersion: wide bank disagreement means larger tail moves at the print. Traders should size positions assuming 1.5–2x normal volatility windows around the release and avoid holding maximum leverage through the number.
Start Trading on CoinUnited.io
Create Your Free Account → — Trade crypto, stocks, forex, indices, and commodities with up to 2000x leverage and zero fees.
Frequently Asked Questions
A hot print (core m/m ≥ 0.4%) typically drives 60–100 pip USD strength within 30 minutes of release — at 100x leverage, that translates to a 6–10% margin swing on EUR/USD shorts, which is favourable, but a cool surprise reverses that instantly and can trigger stop-outs.
Continue Exploring
Disclaimer: This brief is for educational purposes only and is not investment advice.