Quick Links
Gold Hits Two-Month Lows, Silver Falls 2.7%: US-Iran Optimism Flushes Geopolitical Premium — Leverage Scenarios for Metals Traders
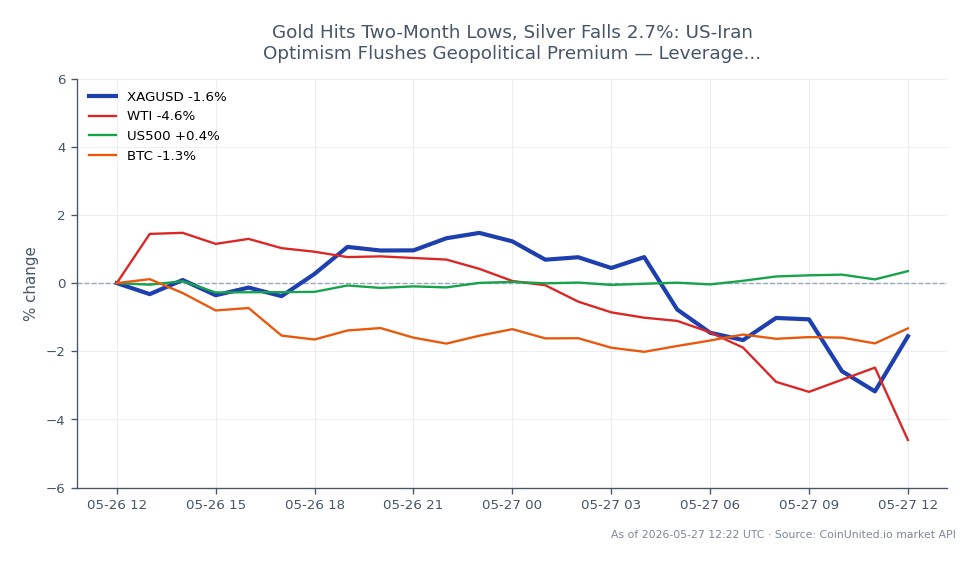
Data Snapshot
Key Takeaways
- •Silver (XAG/USD) is at $74.95, down 2.72%, with a $73.46–$77.53 intraday range — a 5.5% swing that creates acute liquidation risk for leveraged longs opened near session highs.
- •Gold's selloff from above $5,000 to ~$4,480–$4,500 is driven by three converging forces: US–Iran de-escalation, rising real yields, and USD strength — not a single catalyst.
- •A 50x long silver CFD entered at $77.00 is already down ~13.3% on margin at current $74.95 prices; 100x leverage doubles that drawdown to ~26.6%.
- •Cross-market: WTI crude faces reduced geopolitical premium, S&P 500 gets relief-rally support, but USD strength remains a structural headwind for commodity-linked FX (AUD, ZAR).
- •Bitcoin may decouple from gold if markets read this as a positioning flush rather than broad macro risk-off — watch BTC/gold correlation for rotation signals.
Gold has corrected sharply from its all-time high consolidation zone above $5,000/oz to multi-month lows near $4,480–$4,500, while silver (XAG/USD) is trading at $74.95 — down 2.72% in the past 24 hou
Event Summary
Gold has corrected sharply from its all-time high consolidation zone above $5,000/oz to multi-month lows near $4,480–$4,500, while silver (XAG/USD) is trading at $74.95 — down 2.72% in the past 24 hours, with an intraday range of $73.46–$77.53. As reported by Finance Magnates and corroborated by multiple market commentaries, the selloff reflects a convergence of three forces: easing US–Iran geopolitical tension (reducing war-risk premium priced into precious metals), rising real yields, and a stronger US dollar. One market note described gold suffering its worst five-session performance since 1983 in a prior wave of this same corrective move, with spot prices plunging to approximately $4,098 before a $400 intraday rebound.
Critically, this is not a single-catalyst event. The inflation hedge asset rotation thesis that drove gold above $5,000 is being actively unwound as markets price out both Middle East escalation risk and near-term Fed rate cuts simultaneously — a structurally bearish combination for zero-yield assets.
Leverage Impact Analysis
The volatility regime here is extreme, making leverage sizing the critical variable. Silver's intraday range of $73.46–$77.53 represents a $4.07/oz swing — roughly 5.5% peak-to-trough in a single session.
Worked example — Silver long: A trader entering a 50x long XAG/USD CFD at $77.00 (near the 24h high) now sees price at $74.95 — a $2.05/oz adverse move. At 50x leverage, that represents a ~13.3% loss on margin. At 100x leverage, the same move wipes ~26.6% of margin, putting positions entered at the session high at serious drawdown risk.
Liquidation risk — Gold shorts: Traders who opened short XAU/USD positions near $5,000 targeting multi-month lows have seen significant gains, but the documented $400 intraday rebounds in prior sessions illustrate violent short-squeeze risk. Any diplomatic reversal on US–Iran talks could trigger a rapid mean-reversion squeeze. The fed macro policy crossroads environment adds further uncertainty — a surprise dovish signal could flip the rate narrative fast.
Position sizing note: Given that silver alone has moved 5.5% intraday, traders should treat current conditions as a high-volatility regime. Standard leveraged position sizes appropriate for a 1–2% daily range are likely oversized here. Monitor open interest and funding rates on CoinUnited.io for real-time confirmation of directional commitment.
Cross-Market Impact
The US–Iran de-escalation narrative creates a specific cross-asset read: reduced tail risk on WTI Light Crude Oil as Iranian energy infrastructure strike fears fade, potentially softening crude's geopolitical premium. Lower energy prices in turn reduce the inflation-scare bid for gold — a reinforcing feedback loop.
For the S&P 500 Index, geopolitical relief is net positive, but rising real yields (the co-driver of gold's decline) remain a headwind for duration-sensitive growth sectors. The net equity effect is mixed. Commodity-linked FX — particularly AUD and ZAR — face dual pressure from softer gold and a stronger USD. The gold vs. US dollar inverse relationship is operating at full force here. Bitcoin may partially decouple: if the selloff is read as a positioning flush specific to gold rather than a macro risk-off signal, BTC could absorb rotational flows from the hedge portfolio complex.
Trading Considerations
Key technical levels for silver (XAG/USD): immediate support at $73.46 (24h low); resistance at $77.53 (24h high). For gold, the broken $5,000 psychological level is now overhead resistance; the $4,480–$4,510 zone represents near-term consolidation support per analyst commentary, with deeper support near $4,098 (prior flush low). The macro inflation pressure backdrop means any upside surprise in yields or CPI data could accelerate the next leg lower.
Watch for: US–Iran diplomatic developments (headline risk in either direction), Fed speaker commentary on the rate path, and ETF flow data for signs of institutional re-entry or continued outflows.
Trade Silver / US Dollar on CoinUnited.io
Trade XAGUSD with up to 1000xx leverage → | Create Free Account
Frequently Asked Questions
A 50x long XAG/USD CFD entered at $77.00 faces roughly 13.3% margin loss at $74.95 — continued selling toward the $73.46 session low would approach typical maintenance margin thresholds for high-leverage positions. Traders using 100x or above should treat the $73.46 support level as a critical line.
Continue Exploring
Disclaimer: This brief is for educational purposes only and is not investment advice.