त्वरित लिंक
NZD/USD Breaks to Year-to-Date Lows: Leverage Traders Navigate 0.57 Handle as Fed-RBNZ Divergence Deepens
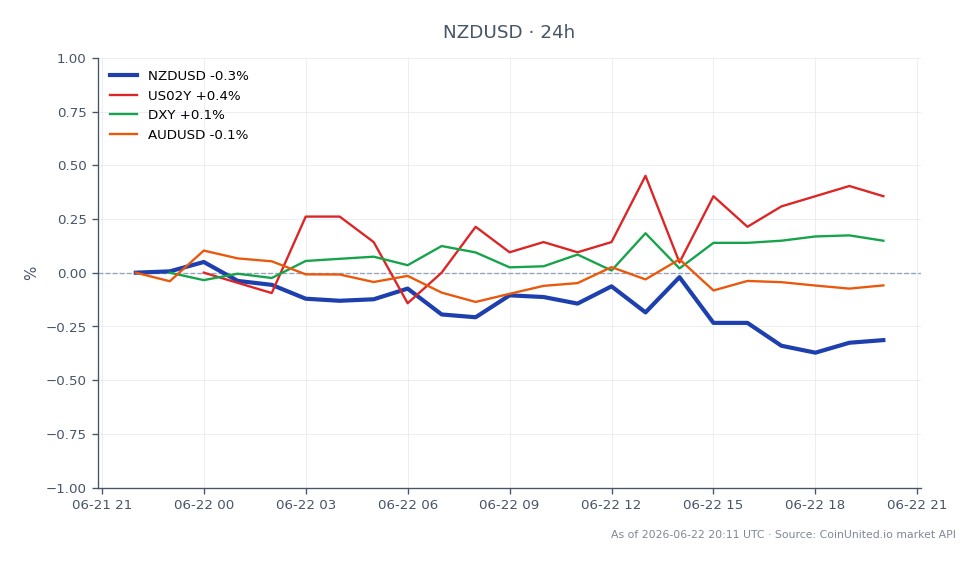
डेटा स्नैपशॉट
मुख्य निष्कर्ष
- •NZD/USD is trading at $0.5715 with a 24h low of $0.5709, pressing against the year-to-date low zone of 0.5705–0.5725.
- •Leverage risk is asymmetric: a 200x long opened at today's high faces liquidation within a ~0.5% move, well inside the current daily range.
- •The driver is dual-sided policy divergence — higher-for-longer Fed expectations strengthening USD, combined with an increasingly dovish RBNZ outlook.
- •Cross-market: USD strength pressuring NZD is also headwind for AUD/USD, and serves as a risk-off signal for crypto and equities.
- •A confirmed break below 0.5705 would set a new yearly low and likely trigger trend-following model short additions — watch for acceleration.
According to FastBull and Investing.com, NZD/USD is sliding toward its yearly low, with spot price currently at $0.5715 — down 0.43% on the day, with a 24-hour range of $0.5709–$0.5741. TradingEconomi
Event Summary
According to FastBull and Investing.com, NZD/USD is sliding toward its yearly low, with spot price currently at $0.5715 — down 0.43% on the day, with a 24-hour range of $0.5709–$0.5741. TradingEconomics identifies the 0.5705–0.5725 band as an 11-week low zone, while Investing.com rates the pair a "Strong Sell" on technicals, with a one-year decline of approximately -4.2% versus the USD.
The macro driver is a textbook Fed macro policy crossroads setup: growing expectations of a higher-for-longer Federal Reserve combined with a softening Reserve Bank of New Zealand (RBNZ) outlook. As reported by FastBull, the slide is attributed to "growing expectations of further Federal Reserve rate hikes and a stronger USD." Meanwhile, the RBNZ is increasingly expected to pivot toward cuts as NZ labor market slack builds — creating a widening rate differential against NZD.
Leverage Impact Analysis
With NZD/USD at $0.5715 and the 24h low at $0.5709, leveraged short positions are approaching maximum profitability near the yearly low zone — but the risk of a short-covering squeeze is rising.
Worked example — Short position: A trader opening a 100x short NZD/USD CFD at $0.5741 (24h high) now sees price at $0.5715 — a move of 26 pips. At 100x leverage on a $1,000 margin, that 0.45% move generates approximately $45 unrealized profit — but the same math works in reverse if a macro catalyst triggers a squeeze.
Liquidation risk for long positions: A 200x long NZD/USD opened at $0.5741 faces liquidation with only a ~0.5% adverse move — well within the current 24h range of 32 pips. Traders holding high-leverage longs near this year's low zone are exposed to continuation risk if $0.5705 breaks decisively.
Key threshold: A confirmed close below $0.5705 would represent a fresh yearly low and likely trigger CTA trend-following models to add short exposure, accelerating the move. Monitor funding rates and open interest on CoinUnited.io for confirmation signals.
Cross-Market Impact
This move is a symptom of broad FOMC inflation policy crossroads dynamics rippling across asset classes:
- -AUD/USD: As a fellow high-beta Oceania currency, AUD faces similar pressure. The AUD/USD trading guide notes RBA-Fed divergence as a key driver — watch for AUDNZD widening if RBA holds relatively firmer.
- -DXY (US Dollar Index): NZD weakness is a direct consequence of USD strength. A DXY push higher would intensify pressure on the 0.5705 support.
- -EUR/USD: Euro faces its own headwinds under Fed-ECB divergence, though NZD is underperforming EUR on a relative basis given the RBNZ's dovish shift.
- -US 2-Year Yield: The front-end is the key transmission mechanism — rising US 2Y yields directly widen the NZ-US rate differential and reinforce NZD selling pressure.
- -Crypto/Risk Assets: NZD as a high-beta risk currency serves as a co-indicator. Persistent NZD weakness alongside a strong DXY signals risk-off conditions that historically create headwinds for crypto markets and long-duration risk assets.
Trading Considerations
The immediate battleground is the 0.5705–0.5725 zone. A weekly close below 0.5705 opens a technical void toward prior multi-year support levels, with limited visible structure until the 0.56 handle. Resistance on any bounce sits at 0.5741–0.5760, aligned with the daily moving average cluster.
Key catalysts to monitor: US CPI/PCE prints and ISM data for Fed path repricing; RBNZ communications for any surprise hawkish shift; and NZ domestic labor/inflation data that could challenge the dovish consensus. Given that macro data can drop outside US market hours, CoinUnited's 24/7 forex trading allows traders to react to RBNZ overnight statements or Asian-session USD moves without waiting for traditional session opens.
Trade New Zealand Dollar / US Dollar on CoinUnited.io
Trade NZDUSD with up to 2000xx leverage → | Create Free Account
अक्सर पूछे जाने वाले प्रश्न
A 200x long opened at $0.5741 faces liquidation with roughly a 0.5% adverse move — approximately $0.5712 — which is already within today's trading range. Traders should size positions conservatively and set stops above the 0.5705 yearly low zone.
जारी रखें अन्वेषण
अस्वीकरण: यह संक्षेप केवल शैक्षिक उद्देश्यों के लिए है और यह निवेश सलाह नहीं है।