Quick Links
US Futures Drift Lower Into Inflation Print — Leverage Liquidation Zones and Cross-Market Risk Map
Data Snapshot
Key Takeaways
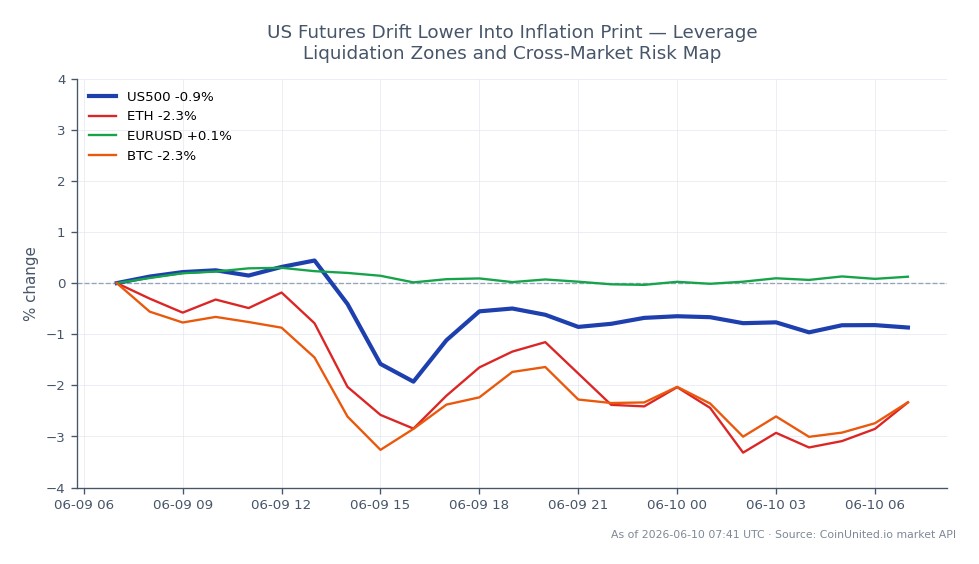
- •US500 is trading at $7,357.85 (-0.06%), range-bound between $7,346.35 and $7,385.65 — a breakout in either direction is driven by the inflation print.
- •Leverage risk is elevated: a 50x long US500 CFD loses ~100% margin on a 2% drawdown; prior hot CPI sessions have produced Nasdaq-100 drops of 0.9%–2.8% intraday.
- •A hot inflation print reinforces 'higher-for-longer' Fed expectations — bearish for tech/growth stocks, EUR/USD, and crypto (BTC, ETH) through dollar-liquidity tightening.
- •Gold's reaction is two-sided: sticky inflation supports it as a hedge, but a sharp real-yield spike (the more hawkish scenario) can cap gains.
- •Financials and cyclicals may diverge from broad index weakness — sector rotation is the key alpha signal to monitor post-print.
US equity index futures are holding lower ahead of a key inflation data release, with the S&P 500 Index currently trading at $7,357.85 — down 0.06% on the session, off a 24-hour high of $7,385.65. As
Event Summary
US equity index futures are holding lower ahead of a key inflation data release, with the S&P 500 Index currently trading at $7,357.85 — down 0.06% on the session, off a 24-hour high of $7,385.65. As reported by Bloomberg and corroborated by multiple market sources, prior sessions have seen S&P 500 futures fall between -0.1% and -0.7% in similar pre-data setups, with the Nasdaq-100 and Dow Jones futures moving in tandem.
The core concern driving the pullback is macro inflation pressure: core PCE has been running above the Fed's 2% target (consensus near 3.0% y/y), and recent Fed communications signal openness to keeping rates higher for longer — or even resuming hikes — if inflation remains sticky. This places the upcoming print squarely at the Fed macro policy crossroads, where a hotter-than-expected number could trigger a meaningful repricing of the rate path.
Leverage Impact Analysis
With US500 at $7,357.85, leveraged index CFD traders face asymmetric risk around the inflation release. This is a classic macro inflation risk-off repricing scenario where volatility can spike sharply in either direction.
Scenario A — Hot print (bearish): A trader holding a 50x long US500 CFD entered at $7,357.85 would face a ~$36,789 loss per contract on a 1% drawdown to ~$7,284. At 100x leverage, the same move represents a ~100% margin wipe. Prior hot CPI sessions have produced intraday drops of 0.9%–2.8% in the Nasdaq-100, per Bloomberg data.
Scenario B — Soft print (bullish squeeze): Shorts are also exposed. A 50x short US500 at $7,357.85 faces liquidation pressure if the index rallies back toward the 24h high of $7,385.65 — a move of just 0.38% from current levels. Position sizing below 10x is advisable into the release for traders without defined stops.
Tech and semiconductor names are the highest-beta exposure within the index. Per research sources, the Philadelphia Semiconductor Index surged ~60% in six weeks before a prior hot CPI print, then dropped 0.9% in a single session — illustrating how crowded positions unwind violently on inflation surprises. Monitor open interest on CoinUnited.io for confirmation of positioning bias.
Cross-Market Impact
The inflation setup creates a clear multi-asset cascade. A hotter print would likely: (1) push EUR/USD lower as the USD strengthens on higher-for-longer Fed pricing; (2) pressure Bitcoin and Ethereum as dollar liquidity tightens and risk premia widen — crypto increasingly trades as a high-beta risk proxy; (3) send WTI Crude Oil higher if inflation is energy-driven, reinforcing the rate-concern feedback loop.
Gold presents the most nuanced read: sticky inflation with contained real yields supports gold as an inflation hedge, but a sharp spike in real yields — the more likely outcome if the Fed turns hawkish — can cap the rally. For a deeper breakdown of this dynamic, see the Gold vs. US Dollar trader's guide. Financials and some cyclicals may diverge positively from broad index weakness, as a steeper yield curve benefits bank net interest margins.
Trading Considerations
US500 is consolidating in a tight range between the 24h low of $7,346.35 and the 24h high of $7,385.65 — a band of just 39 points. A decisive break of $7,346 on a hot print opens a volume profile void toward prior session lows. Resistance sits at $7,385 ahead of any soft-data relief rally. For a comprehensive framework on trading these setups, the CPI & inflation data trading guide covers every major asset class.
Key risk: the -0.06% pre-data drift reflects position-trimming, not full risk-off. This means the market is not fully hedged — surprise in either direction can produce outsized moves. Reduce leverage or tighten stops before the release.
Trade S&P 500 Index on CoinUnited.io
Trade US500 with up to 2000xx leverage → | Create Free Account
Frequently Asked Questions
Given the 39-point intraday range and potential for 0.9%–2.8% moves on a surprise, traders should consider keeping leverage below 10x unless stops are tightly defined near the range boundaries ($7,346 support / $7,385 resistance).
Continue Exploring
Disclaimer: This brief is for educational purposes only and is not investment advice.