Quick Links
Bitcoin Hits 2-Month Low at $83K: $500M Liquidation Cascade and What It Means for Leveraged Traders
Data Snapshot
Key Takeaways
- •BTC hit $83,156 intraday on Jan 29, 2026 — a 2-month low — with $500M+ in crypto liquidations in 4 hours, per Cointelegraph/TradingView.
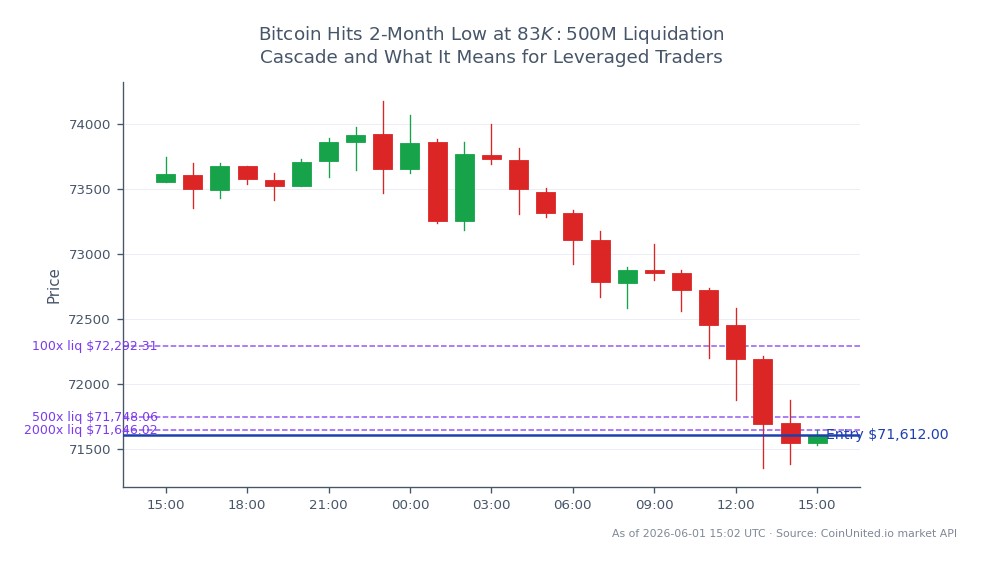
- •Live price at $71,591 means leveraged longs opened above ~$73,000 at 20x are at or near liquidation — position sizing must account for continued downside momentum.
- •Bitcoin ETFs flipped negative YTD as BTC broke the 2026 yearly open, a threshold that triggers institutional rebalancing and retail capitulation flows.
- •The sell-off was cross-asset: gold fell ~$400 from record highs simultaneously, confirming generalized deleveraging rather than a crypto-isolated event.
- •MSTR and BTC-treasury equities face amplified downside as NAV premiums compress during BTC drawdowns — monitor MSTR premium/discount as a sentiment gauge.
As reported by Finance Magnates and Cointelegraph, Bitcoin dropped approximately 6–6.4% intraday to $83,156–$83,383 on January 29, 2026, marking a new 2-month low and the lowest print of 2026. The mov
Event Summary
As reported by Finance Magnates and Cointelegraph, Bitcoin dropped approximately 6–6.4% intraday to $83,156–$83,383 on January 29, 2026, marking a new 2-month low and the lowest print of 2026. The move broke below the yearly open — a key technical trigger — and was accompanied by over $500M in crypto liquidations within four hours, according to TradingView/Cointelegraph data.
The sell-off was not crypto-isolated. Cointelegraph noted that stocks and precious metals declined simultaneously, framing the episode as a macro de-risking event driven by nerves over global financial stability. Bitcoin ETFs, whose NAV tracks spot BTC, flipped negative on a year-to-date basis as prices broke below early-January levels — a threshold that can trigger retail capitulation and institutional rebalancing.
Leverage Impact Analysis
This event is a textbook crypto treasury liquidation cascade. The $500M liquidation figure signals that leveraged long perpetual positions were the primary fuel — not discretionary selling.
Worked example — high-leverage long: A trader using 50x leverage on a BTC perpetual opened at $90,000 holds a liquidation price approximately 2% below entry (~$88,200). At $83,156 that position was liquidated long ago. Even a 10x long opened at $91,000 faces liquidation near $82,000 — dangerously close to the intraday low of $83,156 reported.
Using live market data (BTC currently at $71,591, 24h low $71,353), the picture is more severe: a 20x long opened at $83,000 during the initial bounce would already be liquidated. Mechanical sellers — trend-following CTAs and volatility-targeting strategies — remain in control while price stays below the yearly open. This extends moves beyond fundamental value and creates overshoot-then-mean-reversion dynamics once liquidation flows exhaust.
Funding rates on perpetuals are likely normalizing or turning negative as long OI is cleared. Traders should monitor open interest for stabilization before attempting counter-trend longs. For position sizing, check current funding rates on CoinUnited.io before entering directional perpetual positions.
Cross-Market Impact
The simultaneous sell-off across crypto, equities, and gold marks a generalized deleveraging episode — not an idiosyncratic BTC event. Gold's reported $400 intraday drop from a record ~$5,600 indicates winners were sold to cover margin on crypto losses, a hallmark of cross-asset forced liquidation.
Crypto-proxy equities: MicroStrategy (MSTR) — which holds BTC as its primary treasury asset — faces direct mark-to-market pressure. Per the MSTR NAV gap trading guide, MSTR typically trades at a premium to BTC NAV; that premium compresses sharply during BTC drawdowns, amplifying equity-side losses beyond BTC's own decline. Bitcoin miners similarly trade at 2–4x BTC's daily beta.
Risk-off macro flows: A broad risk-off repricing of this nature typically supports USD strength as funding currencies are repatriated, pressures high-beta EM FX, and bids short-duration sovereign bonds. Growth/AI-adjacent equities face correlated pressure given BTC's current high-beta risk-asset behavior.
Trading Considerations
BTC is currently trading at $71,591 (24h range: $71,353–$74,180), well below the $83K levels that triggered the initial liquidation cascade. The break of the 2026 yearly open remains the key regime signal — sustained trade below this level keeps Bitcoin ETFs negative YTD and sustains systematic selling pressure. Key signals to watch: open interest stabilization (confirms liquidation exhaustion), ETF flow data turning from outflow to neutral, and BTC's correlation with equity indices — a de-correlation would signal the macro de-risking phase is ending.
For the 2026 crypto market outlook, this episode underscores that BTC's high-beta status in multi-asset portfolios makes it a first-mover in both risk-on rallies and risk-off sell-offs.
Trade Bitcoin on CoinUnited.io
Trade BTC with up to 2000xx leverage → | Create Free Account
Frequently Asked Questions
With BTC at $71,591, a 20x long opened at $75,000 has a liquidation price near $71,250 — just below the current 24h low of $71,353. Traders should reduce leverage or widen stop buffers significantly in this environment.
Continue Exploring
Disclaimer: This brief is for educational purposes only and is not investment advice.