Quick Links
RS Group Surges ~8% on FY26 Profit Beat and £100M Buyback: Leverage Scenarios & Sector Read-Through
Data Snapshot
Key Takeaways
- •RS Group shares jumped ~8% on FY26 adjusted PBT coming in marginally ahead of ~£241m consensus, paired with a £100m share buyback announcement.
- •Leverage alert: A 50x long RSG CFD at $214.90 amplifies the 24h high-to-low range (~1.8%) to ~90% margin gain/loss — position sizing and stop placement are critical after a large gap event.
- •The profit beat was margin- and cost-driven, NOT top-line growth; revenue missed and Americas conditions deteriorated — re-rating sustainability requires monitoring.
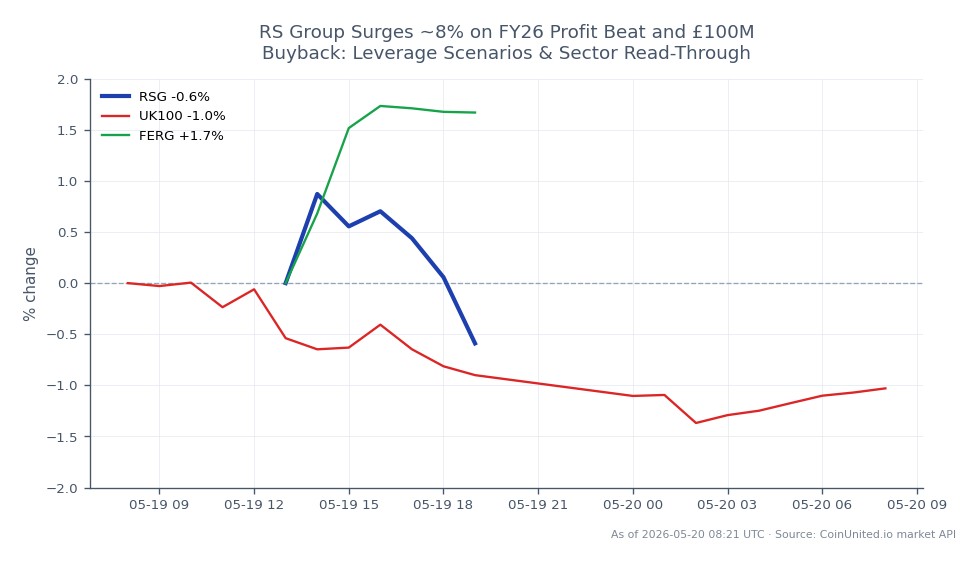
- •Cross-market: Ferguson Enterprises receives a positive sector read-through; FTSE 100 sees modest upward industrial sector support; no direct crypto or commodity transmission.
- •Key level to watch: $214.88 intraday low as gap support — a break below signals potential mean-reversion for leveraged longs.
RS Group PLC, the London-listed industrial and electronic products distributor, saw shares jump approximately 8% after reporting full-year adjusted profit before tax for the 12 months to 31 March 2026
Event Summary
RS Group PLC, the London-listed industrial and electronic products distributor, saw shares jump approximately 8% after reporting full-year adjusted profit before tax for the 12 months to 31 March 2026 coming in marginally ahead of company-compiled consensus near £241m. As reported by Investing.com, the profit beat was accompanied by a £100m share buyback announcement — a capital return representing an estimated 3–6% of market capitalisation. Notably, revenue missed expectations and management flagged deteriorating conditions in the Americas, meaning the earnings outperformance was driven by cost discipline and margin management rather than top-line growth.
Live market data places RSG at $214.90 (24h range: $214.88–$218.81, +0.22%), suggesting the initial gap-up is consolidating. Traders watching the equity offering & capital markets surge theme will note this event fits the pattern of buyback-driven re-ratings in industrial mid-caps under revenue pressure.
Leverage Impact Analysis
CoinUnited.io offers stock CFDs with up to 2000x leverage, making RS Group's sharp single-day move a high-stakes event for leveraged traders.
Long CFD scenario: A trader opening a 50x long RSG CFD at $214.90 controls $10,745 of exposure per $214.90 margin. A move to the 24h high of $218.81 (+1.82%) generates a leveraged gain of ~91% on margin — but the same leverage amplifies any mean-reversion equally. With an ~8% gap already priced in at open, chasing momentum at current levels risks entering near intraday highs with limited buffer before stop-out.
Short squeeze dynamics: The magnitude of the move — 6–8% on a large UK industrial distributor — implies short positioning was elevated. Any remaining short CFD holders above the $214.88 low face continued squeeze pressure if institutional buying confirms the re-rating. Monitor open interest on CoinUnited.io for confirmation signals.
Position sizing note: Given the profit beat was described as only "marginally ahead" of consensus and revenue missed, the re-rating sustainability is uncertain. For leveraged longs, tighter stops and reduced sizing are prudent until the next full analyst revision cycle. For guidance on trading earnings beats with leverage strategies, size accordingly.
Cross-Market Impact
RS Group's result is primarily a UK mid-cap equity event with limited direct macro spillover, but several sector read-throughs matter:
UK Indices (FTSE 100): RS Group carries material but not dominant index weight. The 8% move adds modest upward pressure to UK industrial sector weighting, with positive read-through for the broader financials and industrials earnings beat theme.
Sector peers: Ferguson Enterprises Inc. — a UK-origin industrial distributor now US-listed — is the most direct comparable. RS's margin resilience despite revenue weakness is a net positive for Ferguson's sentiment, though RS flagged Americas deterioration, which warrants caution. European peer Rexel faces similar dynamics; a profit beat via cost control at RS signals distributor margins can hold even in soft demand environments.
Macro signal: The result confirms industrial MRO demand is mixed but not collapsing — a micro datapoint consistent with the broader diversified sector earnings beat wave. No direct FX, commodity, or crypto transmission is expected from this single event.
Trading Considerations
Key levels to watch: RSG's 24h range of $214.88–$218.81 defines immediate support and resistance. A hold above $214.88 keeps the bullish gap intact; a break below risks filling the event gap and testing pre-announcement levels. Volume confirmation of institutional accumulation — not yet visible in live data — is the key validation signal for medium-term longs.
The core risk: the profit beat was margin-driven amid revenue weakness. If FY27 consensus upgrades are modest or management guides cautiously on Americas conditions, the re-rating could partially reverse. Verify the £100m buyback details via RS Group's official RNS before sizing positions for multi-day holds.
Trade Republic Services, Inc. on CoinUnited.io
Frequently Asked Questions
The gap is already priced in at $214.90, so new longs enter near the top of the 24h range ($218.81 high). At 50x leverage, even a 2% pullback to gap-fill levels erases ~100% of margin — use tight stops and confirm institutional buying before sizing up.
Continue Exploring
Disclaimer: This brief is for educational purposes only and is not investment advice.