Quick Links
Strategy Buys 1,587 BTC for $100M — Saylor's $63K Average Price Sets a New Market Reference Level
Data Snapshot
Key Takeaways
- •Strategy added 1,587 BTC at $63,024 avg (June 8–14), lifting total holdings to 846,842 BTC (~4% of max supply), funded via ATM equity sales — not debt or BTC liquidation.
- •Leverage risk: BTC longs at >50x opened above $66,000 face liquidation exposure if price retraces to the $64,700–$65,200 range; the $63,024 Saylor buy level is a widely-watched structural support.
- •The purchase averages down Strategy's aggregate cost basis from ~$75,656/BTC — signaling conviction-driven accumulation at discounted prices, not momentum chasing.
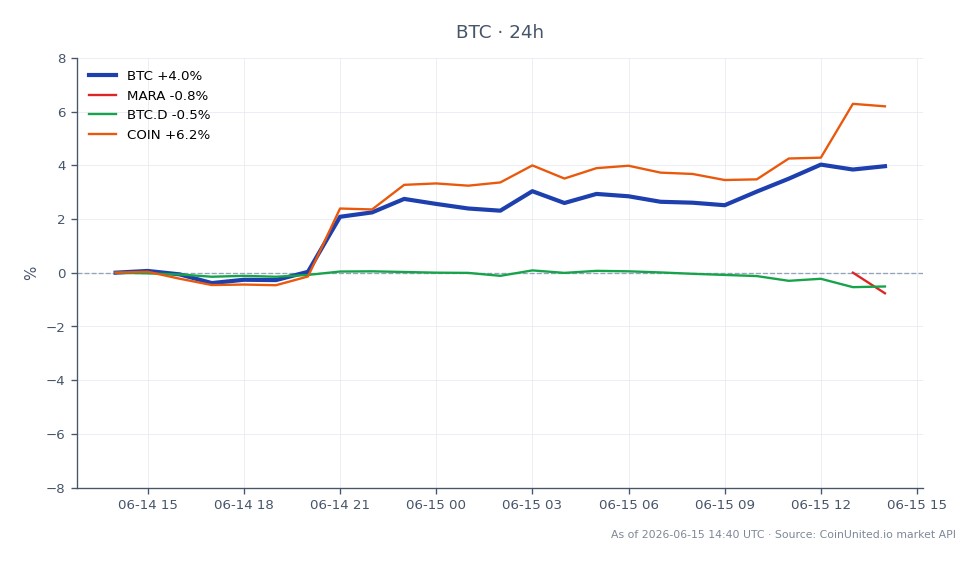
- •Cross-market: MSTR, MARA, RIOT, and COIN all carry positive read-through; monitor MSTR's NAV premium to BTC for pair-trade opportunities.
- •The $63,024 level is now a public demand anchor — short-sellers targeting levels near or below that zone face elevated risk of demand absorption from repeat corporate buyers.
According to multiple outlets including Bitcoin.com and Crypto-Economy, Strategy (Michael Saylor's company) acquired 1,587 BTC for approximately $100 million between June 8–14, 2026, at an average pri
Event Summary
According to multiple outlets including Bitcoin.com and Crypto-Economy, Strategy (Michael Saylor's company) acquired 1,587 BTC for approximately $100 million between June 8–14, 2026, at an average price of $63,024 per BTC. This lifts the firm's total Bitcoin holdings to 846,842 BTC — roughly 4% of Bitcoin's fixed 21 million supply — making Strategy the largest publicly traded corporate BTC holder by a wide margin.
The purchase was funded via ATM (at-the-market) equity share sales, not BTC liquidation. Strategy's USD cash reserve simultaneously rose to $1.1 billion, reflecting a dual-reserve model. Notably, Strategy's aggregate cost basis across all holdings sits at approximately $75,656 per BTC — meaning this tranche was acquired ~$12,600 *below* the firm's historical average, actively averaging down its break-even price.
Leverage Impact Analysis
With BTC currently trading at $66,444 (up +3.35% on the day, 24h high $66,915), Saylor's $63,024 average buy price is now sitting ~$3,400 below spot — a critical reference.
Long scenario: A trader running a 50x long BTC perpetual opened at $65,000 is sitting on approximately +2.2% in price move terms, which translates to +110% on margin at 50x. With BTC's 24h low at $64,918, that same position saw only ~$80 drawdown from entry — manageable. However, at 100x leverage, a retracement back to $63,024 (Saylor's buy zone) would represent a ~$1,400 adverse move, or ~140% of initial margin — a full liquidation event at most standard margin models.
Liquidation watch: Traders holding >50x BTC longs opened above $66,000 face liquidation if BTC retraces below approximately $64,700–$65,200 depending on platform margin requirements. Monitor funding rates on CoinUnited.io — elevated long-side funding would signal crowded positioning that could amplify a flush toward the $63,000 support zone.
The $63,024 level is now a publicly anchored demand reference under the Saylor BTC accumulation resumption thesis — traders may treat dips toward this zone as a high-conviction re-load area, potentially compressing short-side opportunities near that level.
Cross-Market Impact
This buy reinforces the broader bitcoin corporate treasury accumulation wave. Crypto-proxy equities are the most direct read-through:
- -MSTR trades as a leveraged BTC proxy; each programmatic buy increases BTC-per-share optionality. Check the current NAV premium — when MSTR trades at a significant premium to its BTC holdings, it can underperform BTC on rallies and outperform on dips.
- -MARA and RIOT benefit from the "institutional demand" narrative; BTC above miners' cost curves supports margin expansion sentiment.
- -COIN sees indirect tailwinds from rising BTC prices boosting trading volumes and custody AUM.
On the macro side, the ATM equity-funded BTC buy is a capital rotation signal — USD cash → BTC — consistent with the inflation hedge asset rotation theme. Gold traders should note BTC's continued absorption of "hard asset" allocation flows, though at $100M notional, the FX and commodity impact remains narrative-driven rather than flow-driven.
Trading Considerations
Key levels: $63,024 (Saylor's average entry — structural support zone), $64,918 (today's 24h low — near-term demand confirmation), $66,915 (24h high — immediate resistance). A clean break above $66,915 with volume opens the path toward prior highs. Failure to hold $64,918 would signal short-term exhaustion and expose $63,000 as the next meaningful support.
Watch open interest trends and check funding rates — if long funding is elevated while BTC stalls below $66,915, a short-term squeeze back toward $63,024 is possible before any continuation higher.
Trade Bitcoin on CoinUnited.io
Trade BTC with up to 2000xx leverage → | Create Free Account
Frequently Asked Questions
With BTC at $66,444, the $63,024 level sits ~$3,400 below spot and functions as a structural demand floor — traders running >100x longs opened near current prices would face liquidation on a retracement to that zone, so it defines a critical risk boundary. Conversely, long traders near $63–64K have a credible corporate bid beneath them.
Continue Exploring
Disclaimer: This brief is for educational purposes only and is not investment advice.