روابط سريعة
Deutsche Bank's Fed/ETF/AI Framework Explains Bitcoin's Sub-$60K Break — What Leveraged Traders Must Know
لقطة بيانات
النقاط الرئيسية
- •BTC is trading at $62,370 with a 24h low of $61,876 — 100x leveraged longs opened above $62,500 have less than 0.13% buffer before liquidation.
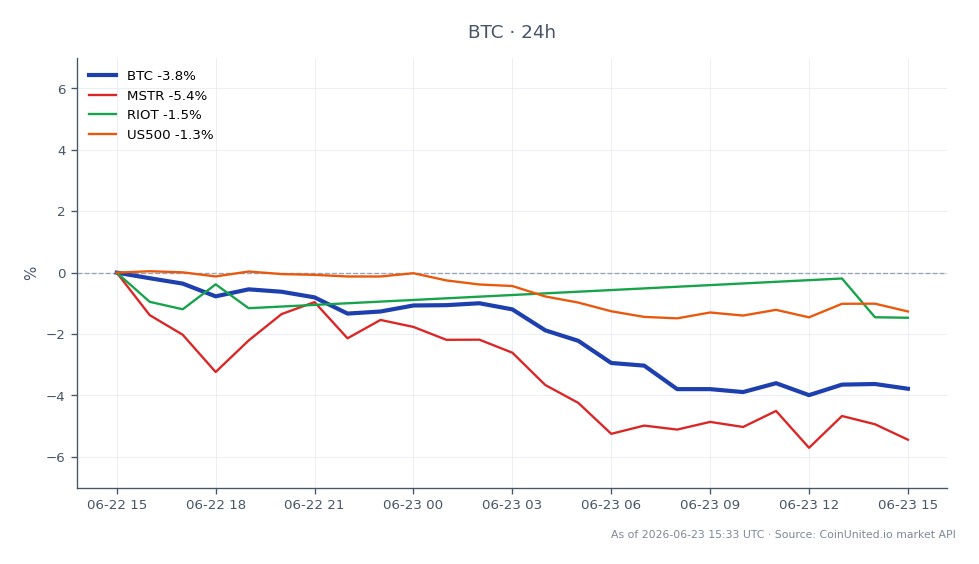
- •Deutsche Bank documents BTC-Nasdaq correlation at ~80%, meaning Fed rate expectations and AI/tech equity de-risking are now primary BTC price drivers.
- •The $60,000 level is a major liquidation cluster — a retest would likely trigger cascading long liquidations across perpetual futures markets.
- •Crypto-proxy equities (MSTR, MARA, RIOT) face amplified downside as BTC approaches miner cost-of-production zones near $60K.
- •DXY strength tied to higher-for-longer Fed expectations adds a structural headwind — monitor FOMC guidance and ETF flow data as key leading indicators.
Bitcoin has confirmed a break below the $60,000 threshold — its first since late 2024 — following a week-long selloff that has erased gains from the post-election rally. According to live market data,
Event Summary
Bitcoin has confirmed a break below the $60,000 threshold — its first since late 2024 — following a week-long selloff that has erased gains from the post-election rally. According to live market data, BTC is currently trading at $62,370, down 3.97% in 24 hours, having printed a session low of $61,876. The move is a sustained distribution event, not a single-session flash crash.
As reported by Deutsche Bank's flow research, this selloff reflects a structural regime shift: cryptocurrencies are now "increasingly impacted by macroeconomics," particularly interest rate hikes, which trigger reallocation from crypto to safe-haven assets. Deutsche Bank documents that Bitcoin's correlation with the Nasdaq Composite and S&P 500 has surged from ~20% to nearly 80% over the past six months — meaning the Fed macro policy crossroads now directly governs BTC price action.
Leverage Impact Analysis
The $60,000 level is a critical liquidation cluster. With BTC at $62,370, leveraged longs opened near $63,000–$65,000 are in active drawdown territory:
- -50x long BTC at $63,000: Current price represents a ~1.0% adverse move = ~50% of margin consumed. A further drop to $61,740 triggers full liquidation.
- -100x long BTC at $62,500: Only 0.13% buffer remains before liquidation — effectively no margin for error at current levels.
- -20x long BTC at $64,000: Approximately 8.7% adverse move already absorbed (~174% of 1x move against position) — still holding but at elevated risk if $61,876 session low is retested.
The week-long nature of the selloff implies sustained negative crypto funding rates, as perpetual futures traders continue to pay bears. Monitor funding rates on CoinUnited.io for confirmation of positioning exhaustion before any mean-reversion trade. Open interest data should also be tracked — rising OI into declining price signals ongoing short build-up, not capitulation.
For new positions, the AI capital reallocation wave adds a second layer of vol risk: any sharp repricing in tech/AI names can cascade into BTC liquidations given the 80% correlation.
Cross-Market Impact
Deutsche Bank's ~80% BTC-Nasdaq correlation makes this a multi-asset event. The NASDAQ-100 Index and S&P 500 face indirect headwinds as crypto vol spikes can trigger systematic de-risking across cross-asset vol-target and risk-parity strategies.
Crypto-proxy equities face the sharpest secondary pressure. MicroStrategy (MSTR) carries extreme BTC balance-sheet leverage — see the MSTR NAV gap trading guide — meaning a sustained sub-$62K BTC print compresses NAV and can trigger a wider NAV discount. Riot Platforms and MARA face direct margin compression as BTC falls toward miner cost-of-production zones near $60K.
FX: Higher-for-longer Fed expectations reinforce USD strength (DXY bid), which historically correlates with BTC headwinds. The Fed & ECB rate patience macro repricing theme remains the dominant macro driver.
Commodities: Gold benefits from the risk-off rotation, while industrial commodities face demand-reduction risk if equity de-risking broadens.
Trading Considerations
Key levels: $61,876 (session low / near-term support), $60,000 (psychological and liquidation cluster), $64,327 (24h high / short-term resistance). A clean reclaim of $64,000 with volume would be the first signal of distribution exhaustion. Below $61,876, the next meaningful support zone lies at the $60,000 round number where systematic stop-loss and liquidation orders are likely concentrated.
The primary risk factor remains Fed guidance — any hawkish surprise reinforces the Fed & ECB rate patience regime and extends BTC downside. Watch ETF flow data and Nasdaq futures for correlated confirmation before adding directional exposure.
Trade Bitcoin on CoinUnited.io
Trade BTC with up to 2000xx leverage → | Create Free Account
الأسئلة الشائعة
A 50x long opened at $63,000 on CoinUnited.io uses roughly 2% margin per $1 move — a drop to approximately $61,740 would consume the position's margin entirely. With BTC at $62,370, roughly half the margin is already eroded.
تابع الاستكشاف
إخلاء المسؤولية: هذا الملخص لأغراض تعليمية فقط وليس نصيحة استثمارية.