روابط سريعة
FOMC June 2026 Dot Plot Hawkish Shock: 3.8% End-Year Target Kills Easing Narrative — Leverage Playbook for USD/JPY, Gold & Crypto
لقطة بيانات
النقاط الرئيسية
- •June 2026 dot plot raised the 2026 median Fed funds target to ~3.8% from 3.4% in March (+40bp), eliminating the prior one-cut assumption for 2026.
- •Leverage impact: 100x long USD/JPY at 160.44 faces ~6.2% position loss on a 100-pip adverse move — intervention risk above 160.50 makes this a high-danger zone for leveraged carry traders.
- •The critical binary: if the dot exceeds market pricing (~3.8%), expect USD spike + gold/equity sell-off; if below, expect relief rally and USD long squeeze.
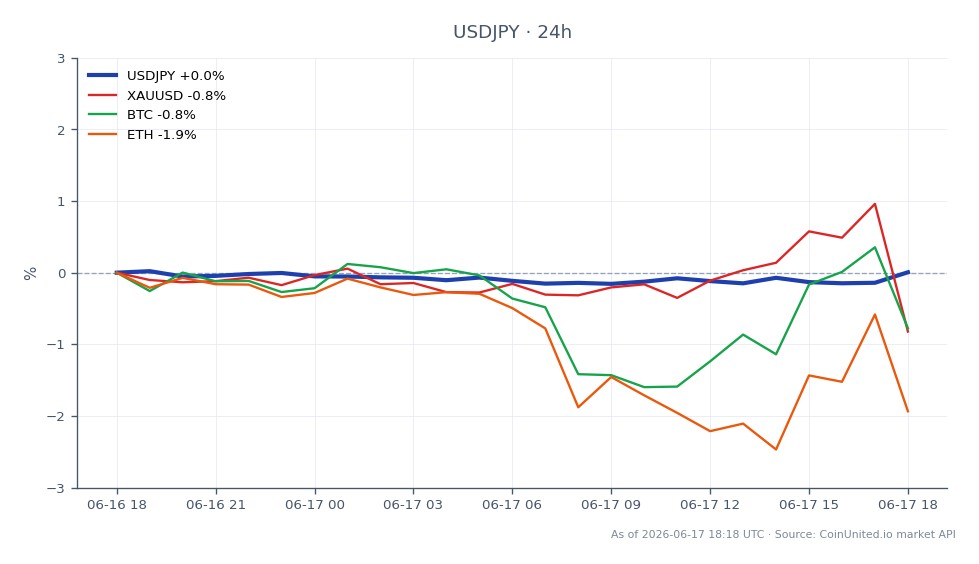
- •Gold and crypto face structural headwinds — higher real yields and stronger USD historically pressure both XAU/USD and BTC/ETH simultaneously.
- •Cross-market: NASDAQ 100 is most vulnerable to multiple compression; financials may outperform via net interest margin support in a higher-for-longer regime.
The Federal Open Market Committee's June 2026 Summary of Economic Projections (SEP) raised the median 2026 federal funds rate dot to approximately 3.8%, up from 3.4% in the March 2026 SEP — a +40 basi
Event Summary
The Federal Open Market Committee's June 2026 Summary of Economic Projections (SEP) raised the median 2026 federal funds rate dot to approximately 3.8%, up from 3.4% in the March 2026 SEP — a +40 basis point hawkish revision that effectively eliminates the prior one-cut assumption for 2026. According to pre-meeting analysis from RexShares and Schwab, futures markets were already pricing near 3.8% by late-2026, meaning the dot confirms rather than dramatically surprises the curve. However, the distribution of dots — with more FOMC members clustering around the current 3.50–3.75% range with no further cuts — and new Chair Kevin Warsh's explicitly hawkish communication style cement a higher-for-longer regime. The revised SEP reflects persistent above-target inflation (March PCE already at 2.7%) and resilient labor markets, per the research report.
Leverage Impact Analysis
This is a high-leverage-relevance event (0.95 score) with immediate FX and rates impact.
USD/JPY — Live Price: $160.44 (24h range: 160.12–160.48)
USD/JPY is trading at a critical level documented across recent FOMC inflation policy crossroads analysis. A hawkish dot confirmation supports USD, pushing USD/JPY toward and potentially above the 160.48 resistance. Japan's intervention threshold — repeatedly flagged in prior pulses — makes this a binary risk zone.
- -50x long USD/JPY at 160.44: A 100-pip move to 161.44 = +3.1% gain on position, but a BoJ-driven reversal to 159.44 = −3.1%, enough to trigger margin calls at high leverage ratios.
- -100x long USD/JPY at 160.44: The same 100-pip adverse move generates −6.2% on position equity — liquidation risk is acute near the intervention zone.
- -Traders should monitor whether the dot print (3.8%) matches or exceeds futures pricing. If the median exceeds 3.8% (e.g., 4.0%), expect a sharp USD spike and intervention risk. If below (3.6%), expect a USD reversal and long-squeeze.
For EUR/USD, a confirmed hawkish dot supports USD strength, pressuring EUR/USD lower. Leveraged EUR/USD shorts benefit; longs with >50x face elevated risk on any dovish surprise.
Check live funding rates on CoinUnited.io before sizing positions — carry costs on high-leverage USD longs will compound against you in a reversal scenario.
Cross-Market Impact
Rates & Fixed Income: The 2Y UST yield should reprice higher, flattening the 2s10s curve. This is the most direct transmission channel from the Fed macro policy crossroads event.
Gold (XAU/USD): Higher real yields and USD strength are structurally negative for gold. The gold vs. US dollar inverse relationship thesis is firmly in play — leveraged gold longs face headwinds; watch for support breaks on any dollar spike.
Equities: Per the S&P 500 FOMC cycles guide, higher-for-longer repricing hits growth/tech multiples hardest. The NASDAQ 100 is the most vulnerable index; financials may outperform via net interest margin support. S&P 500 CFD longs above 50x leverage should tighten stops given duration sensitivity.
Crypto (BTC, ETH): Higher real yields and stronger USD historically pressure BTC and ETH. The macro inflation pressure theme tightens dollar liquidity — negative for high-beta alts. Monitor crypto funding rates for signs of leveraged long unwinding.
Trading Considerations
The key binary for all positions is whether the June dot median prints at, above, or below market pricing of ~3.8%. At 3.8% exactly, the market reaction is muted (already priced). Above 3.8% triggers a hawkish overshoot — USD spike, gold break, equity sell-off, and crypto headwinds intensify. Below 3.8% triggers a relief rally across risk assets and a USD reversal, squeezing leveraged USD longs.
Key levels: USD/JPY intervention zone above 160.50; DXY 99.50 as flagged in previews. Warsh's press conference language on whether 3.8% is described as "still restrictive through 2026" is the secondary catalyst that could extend or reverse initial moves. For USD/JPY dynamics and yen intervention strategy, the risk of a coordinated BoJ response above 161.00 remains elevated.
Trade US Dollar / Japanese Yen on CoinUnited.io
Trade USDJPY with up to 2000xx leverage → | Create Free Account
الأسئلة الشائعة
USD/JPY at 160.44 is near Japan's known intervention threshold (~160.50). A 50x long position gains roughly 3.1% on a 100-pip move higher, but a BoJ-triggered reversal of the same magnitude wipes that gain entirely — at 100x, the loss doubles to ~6.2% on position equity, creating liquidation risk.
تابع الاستكشاف
إخلاء المسؤولية: هذا الملخص لأغراض تعليمية فقط وليس نصيحة استثمارية.